Business demography statistics
Data from November 2023
Planned update: December 2024
Highlights
In 2021, the EU’s business economy was made up of 31.5 million active enterprises, out of which 11 % (3.4 million) were created that year.
In 2021, 3.7 million jobs were created from 3.4 million newly born enterprises in the EU.
This article presents statistical data on business demography in the European Union (EU), treating aspects such as the total number of active enterprises in the business economy, their birth rates, and the survival rate.
Business demography (BD) statistics provide information on the dynamics of the business economy. They capture how the composition of the enterprise population changes over time. They also show how the economic contribution of the business economy in terms of employment develops across a number of enterprise characteristics.
While the statistics presented in this article are generally analysed at the level of NACE sections, readers should note that business demography statistics are available at a much more detailed level (for several hundred activities).
Following the entry into force of the European Business Statistics (EBS) Regulation, Eurostat is publishing, for the first time, final data on business demography. Several improvements enhance the data's capacity for analysis of the activity of enterprises in the EU, in particular for high-growth and young high-growth enterprises (also known as gazelles). The data now cover more economic activities, e.g. within services (education; human health and social work activities; arts, entertainment and recreation) and financial and insurance activities. Moreover, regional business demography statistics are now available for all EU countries.
Business demography covers the business economy (NACE Rev.2 sections B to N, P to R as well as division S95 and S96),which includes: industry, construction and services.
Full article
General overview
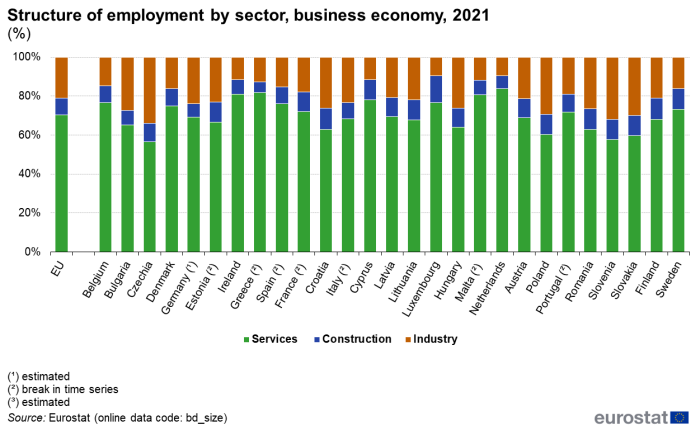
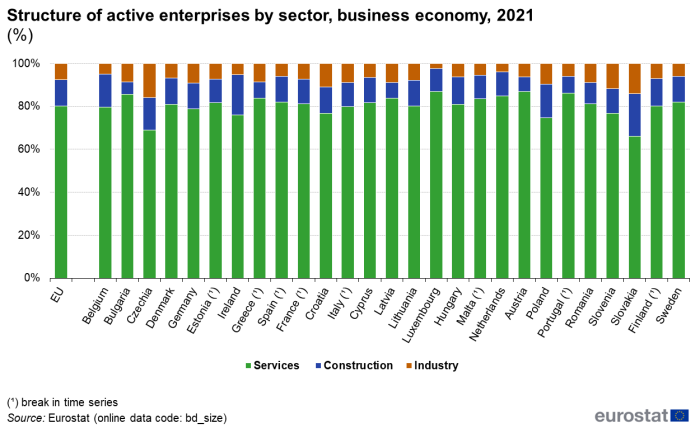
In 2021, the EU’s business economy was made up of 31.5 million active enterprises with around 154 million persons employed. The largest active enterprise population was registered in France (4.8 million) and Italy (4.5 million), followed by Spain (3.4 million) and Germany (3.1 million). As in previous years, the services sector was dominant in every country, as measured by the highest proportion of active enterprises.
There were about 3.7 million jobs created from almost 3.4 million newly born enterprises, based on the final 2021 data. The biggest contribution to the number of newly born enterprises in the business economy and the jobs created was by enterprises in “Professional, scientific and technical activities” and “Wholesale and retail trade; repair of motor vehicles and motorcycles” and “Construction”, together comprising almost half of the enterprise births and their employment.
Active enterprises in the business economy
This section provides an overview of the business enterprise population. It is based on aggregated data for industry (Sections B to E), construction (Section F) and services (Sections G to N and P to R, as well as S95 and S96), according to NACE Rev. 2. In 2021, looking at EU level, over three quarters (80.3 %) of all enterprises active in the business economy (NACE Rev. 2 Sections B to R, S95 and S96) were within the services sector, providing work for over two thirds of the total number of persons employed (see Figures 1 and 2). Services accounted for between 66.0 % of the number of all enterprises in the business economy in Slovakia and 86.9 % of the total in Luxembourg and Austria. In terms of its contribution to employment, the services sector accounted for 56.4 % of the workforce in Czechia, while the Netherlands had the highest share at 83.9 %.
Source: Eurostat (bd_size)
By contrast, only 7.7 % of active enterprises in the EU were found in industry, even though these enterprises provided work for more than 32.5 million persons (21.1 % of the total employment in the business economy). The average size of industrial enterprises (as measured in terms of the number of persons employed) was considerably higher in industry than for services. Indeed, industrial enterprises employed 13 persons on average across the 27 Member States, compared to an average of four persons for services. The average number of persons employed in construction was the lowest, with three persons per enterprise.
Birth and death rates
The birth of new enterprises is often seen as one of the key determinants of job creation and economic growth. Enterprise births are thought to increase the competitiveness of a country's enterprise population, by obliging them to become more efficient in view of newly emerging competition. As such, they stimulate innovation and facilitate the adoption of new technologies, while helping to increase overall productivity within an economy.
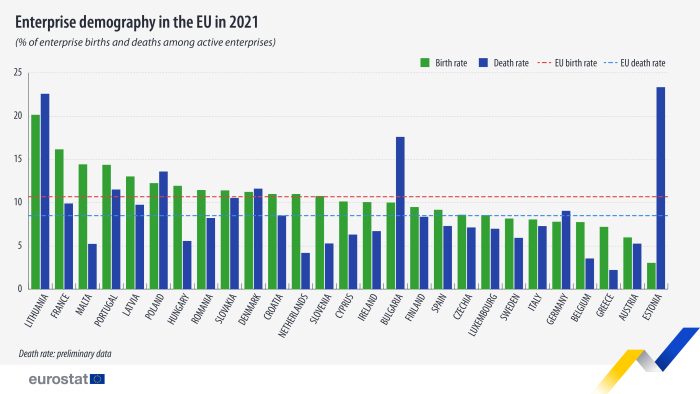
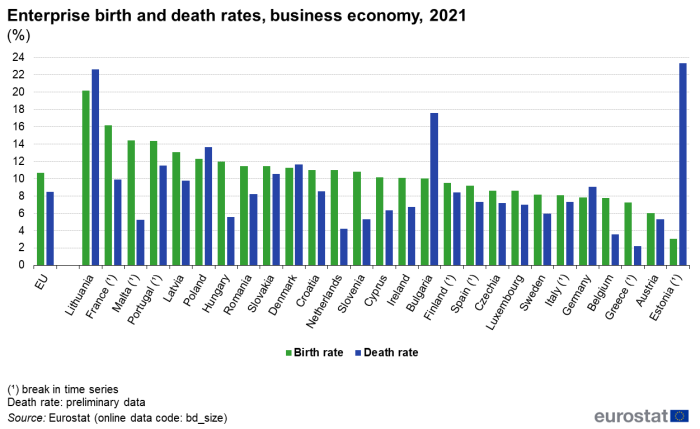
Looking at birth rates in the EU, the number of newly born enterprises as a proportion of the total number of active enterprises ranged from 3.1% in Estonia to 20.2 % in Lithuania in 2021. The birth rate was also low Austria, Greece, Belgium and Germany (each under 8 % ). At the other end of the scale, high birth rates were recorded in 2021 in Lithuania, France, Malta and Portugal (each over 14 % ). - see Figure 3.
In 2021, the rate of enterprise births in the EU was 10.7 % while the preliminary rate of enterprise deaths stood at 8.5 %. The enterprise death rates, which are based on provisional data, were particularly low in Greece (2.2 %), Belgium (3.6 %) and the Netherlands (4.2 %), ranging up to 22.6 % in Lithuania and 23.4 % in Estonia. At EU level, the preliminary rate of enterprise deaths stood 8.5 %.
In most EU countries more companies were created than dissolved. The exceptions to this were Estonia, Lithuania, Bulgaria, Poland, Denmark and Germany where the number of enterprises dissolved surpassed the number of companies created.
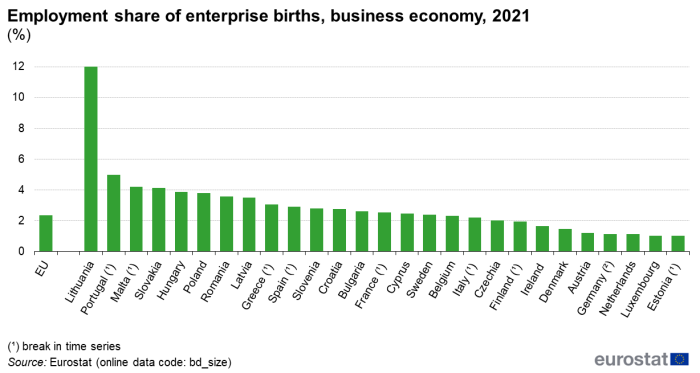
While the study of enterprise birth rates provides useful information on the dynamism in the economy, the effect on the labour market is an important aspect as an indicator of the potential job creations. Figure 4 shows the share of newly born enterprises in total employment of active enterprises, in terms of the number of persons employed. In the total business economy in 2021, the employment share ranges from 1.0 % (Estonia) to 12.0 % (Lithuania). In addition, relatively low shares were recorded in Luxembourg, the Netherlands, Germany, Austria and Denmark, while high shares were recorded in Portugal, Malta, Slovakia, Hungary and Poland.
Source: Eurostat (bd_size)
Enterprise survivals
This section presents information about the life cycle of newly born enterprises and their development over five years. The business demography data collection enables the tracking of newly born enterprises over a five-year period, tracing how many of them have survived during that period. Enterprise survival occurs when an enterprise is active and identifiable both before and after a specific (business) demographic event. The enterprise may be changed in some way, e.g. in terms of economic activity, size, ownership or location, but specifically for survival statistics, all criteria are kept from the year of birth. It is possible to observe such enterprises as there is continuity of the enterprise reference number in the statistical business register.
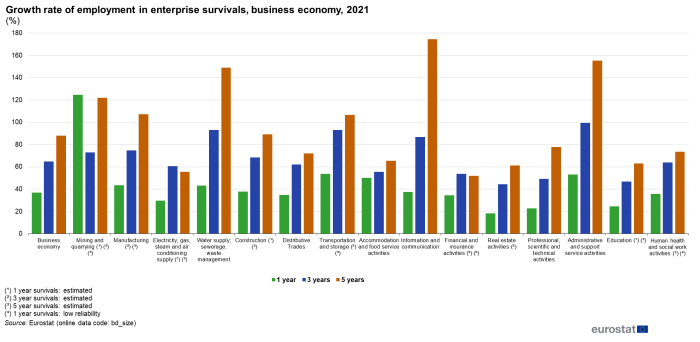
The growth rate of employment in enterprise survivals represents the ratio between the number of persons employed in enterprise survivals and the number of persons employed in the same enterprises in the year of birth. The employment growth rate of the business economy was 88 % for five-years old enterprises, 65 % in the case of enterprises which are three years old and 37 % for the one-year old enterprises.
All economic activities had a similar pattern: the older the enterprise, the higher the growth in the employment. The only exception was “Mining and quarrying”, where three-year old enterprises had much lower growth in terms of employment than five and one-year old enterprises. The highest employment growth in employment was observed in five-year old enterprises, especially in “Information and communication” (175 %), Administrative and support service activities” (155 %), “Water supply; sewerage, waste management” (149 %), “Mining and quarrying” (122 %) and “Manufacturing” (107 %). In all these activities, the five-year old enterprises had a growth rate in employment of over 100 %, which means that the employment in the fifth year is more than double compared with the year of birth. This can be explained by the fact that five-year old enterprises had more years to grow and, if the activity of the enterprises is successful, the enterprise survives and hires more people. In the case of “Mining and quarrying”, also the one-year old enterprises had a growth rate higher than 100 %.
Source: Eurostat (bd_size)
High growth enterprises
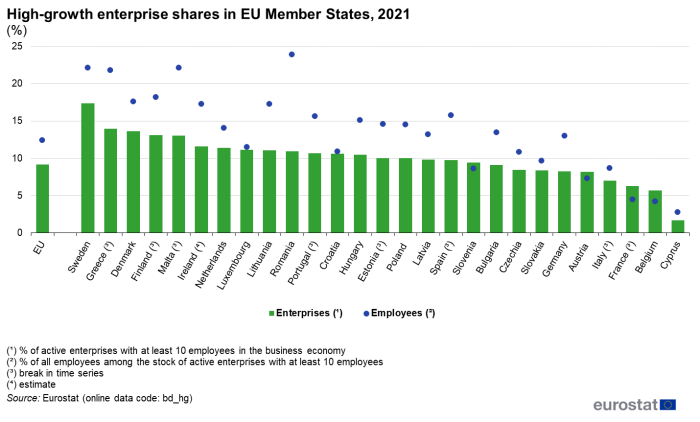
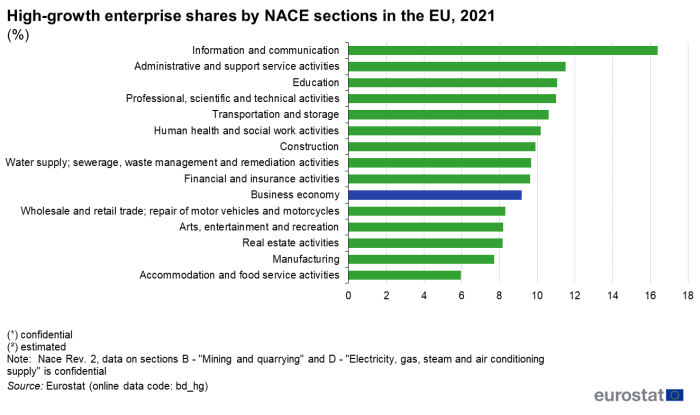
High growth enterprises (growth in employment by more than 10 %) play an important role in the contribution to economic growth and the creation of jobs. In 2021, over 151 000 companies, or almost a tenth (9.2 %) of all active enterprises with at least ten employees in the EU business economy were recognised as high-growth enterprises, providing work for 13.0 million employees.
In 2021, considerable variations were observed across the EU Member States in the distribution of high-growth enterprises (see Figure 7). The shares ranged from 17.4 % in Sweden to less than 6.3 % in France.
High-growth enterprises have a noteworthy impact on employment. In 2021, the highest contributions to the total number of employees with more than 20 % were recorded in Romania, Sweden, Malta and Greece. By contrast, the lowest shares in 2021 were registered by Cyprus (2.8 %), Belgium (4.2 %) and France (4.5 %).
Although high-growth enterprises operate in all sectors of the business economy across the EU, their share in services is higher in the majority of Member States. Looking at a breakdown by economic activity (see Figure 7), high-growth enterprises in 2021 were more predominant in the service sectors, with the highest proportion in "Information and communication" (16.4 %), followed by "Administrative and support service activities" (11.5 %), “Education" (11.1 %) and "Professional, scientific and technical activities" (11.0 %). The first industrial sector in terms of proportions of high-growth enterprises was "Water supply; sewerage, waste management and remediation activities" (9.7 %). The lowest overall figures were recorded in "Accommodation and food services" (6.0 %) and Manufacturing (7.7 %), two sectors strongly hit by the Covid-19 pandemic.
Source: Eurostat (bd_hg)
Source data for tables and graphs
Data sources
Eurostat’s business demography (BD) statistics provide information on the dynamics of the business economy. They capture how the composition of the enterprise population changes over time. They also show how the economic contribution of the business economy in terms of employment develops across a number of enterprise characteristics. Statistical business registers are the main source for BD statistics. Data comes from the national statistical business registers in the EU, EFTA, and enlargement countries. In practice, most of these national statistical business registers are based on a combination of administrative and statistical sources. Business demography statistics cover, amongst other things, the birth, survival (followed up to five years after birth) and death of enterprises within the business population. They report changes in the stock of enterprises within the business economy from one year to the next, reflecting among other things the level of competition, entrepreneurial spirit and the business environment.
Coverage, units and classifications
Business demography covers the business economy, which includes industry, construction and many services ((NACE Rev.2)sections B to N, P to R as well as division S95 and S96). Business demography statistics do not cover agriculture, forestry and fishing, nor public administration.
Starting with the reference year 2021, business demography statistics are compiled under the legal basis of the EU regulation 2019/2152 on European business statistics and its implementing act, EU regulation 2020/1197 on technical specifications and arrangements.
Context
Business demography is an important subject for policy-maker discussions about increasing the level of employment, since it is one of the main priorities of the EU growth strategy.
Enterprise demography reflects, to some degree, the dynamism of the EU economy through the adaptation of economic structures to changing market conditions. The potential contribution that enterprise creation can make to employment is also one of the most important aspects drawing the attention of policy makers to the subject of enterprise demography. In this context, enterprise creation can be seen as an indicator of competitiveness, as a factor of economic growth and as a vital means of creating jobs.
Business demography provides information for births, deaths and survival rates of enterprises, as well as information on related employment data. The two main measures used for employment are the number of persons employed and the number of employees.
The demography of the business population is represented by data on:
- the active population of enterprises;
- their birth;
- their survival (followed up to five years after birth);
- their death.
Particular attention is paid to the impact that these demographic events have on employment levels. Business demography data can be used to analyse the dynamics and innovation of different markets, such as:
- entrepreneurship in terms of the propensity to start a new business, such as analysed in the joint OECD/Eurostat Entrepreneurship Indicators Programme;
- how newly-born enterprises can contribute to the creation of jobs.
Direct access to
- High-growth enterprises - statistics – background article on high-growth enterprises and young high-growth enterprises (gazelles)
- Structural business statistics overview - see chapter “Business demography”
- Structural business statistics - theme entry page
- Structural business statistics introduced - background article on SBS
- Structural business statistics at regional level see chapter 'Enterprise demography: births, deaths and survival'
- Quarterly registrations of new businesses and declarations of bankruptcies - statistics
