Crime statistics
Data extracted in April 2024
Planned article update: April 2025
Highlights
Sexual violence offences continued to rise in the EU in 2022.
Robbery, burglary and theft, 2010-2022
The statistics presented in this article are based on official figures for police-recorded offences (criminal acts) in Europe between 2008 and 2022. The results cover the European Union (EU), the EFTA countries, as well as the candidate countries and the potential candidate countries. The number of police-recorded crimes varies widely across the EU, even relative to population size. This can be due to different laws, different police recording practices and different reporting rate to the police, which can affect comparison. The crimes are classified according to the ICCS (International Classification of Crime for Statistical Purposes). Counting methodologies for offences and persons should be applied. Countries' compliance with the classification of crimes and counting methodologies is explained in the crime metadata.
Full article
3 862 intentional homicides in the EU in 2022
There were 3 862 police-recorded intentional homicides in the EU in 2022, a 4.4 % increase compared with the previous year. An increase was observed in 14 of the 27 EU countries that provided data. The EU rate of police-recorded intentional homicides per hundred thousand inhabitants in 2022 returned to the 2020 value (0.86), after a low reached in 2021 (0.83).
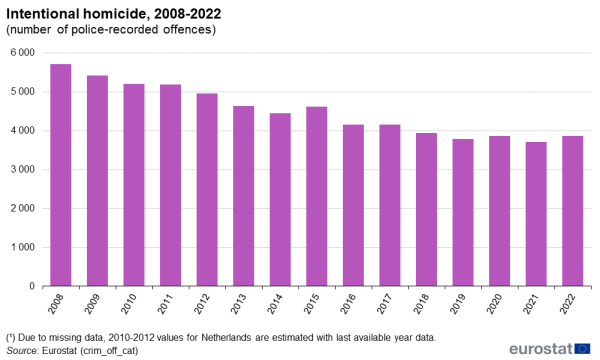
(number of police-recorded offences)
Source: Eurostat (crim_off_cat)
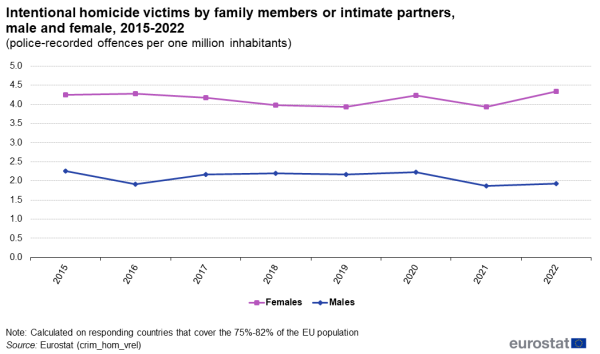
Female victims of intentional homicide killed by family members or intimate partners were 4.3 (per million women) in the EU in 2022 while male victims were 1.9 (per million men)
As shown in Figure 2, the rate of women killed by family members or intimate partners in relation to the population size increased in 2022 compared with the previous year. Looking at the figures per million of women, the rate increased from 3.9 to 4.3 and returned to the 2016 level, the highest in the 2015-2022 period. At the same time, men killed by family members or intimate partners remained unchanged at 1.9 per million men. The values are calculated on the responding countries, covering between 75 % and 82 % of the EU population in the period 2015-2022.
Source: Eurostat (crim_hom_vrel)
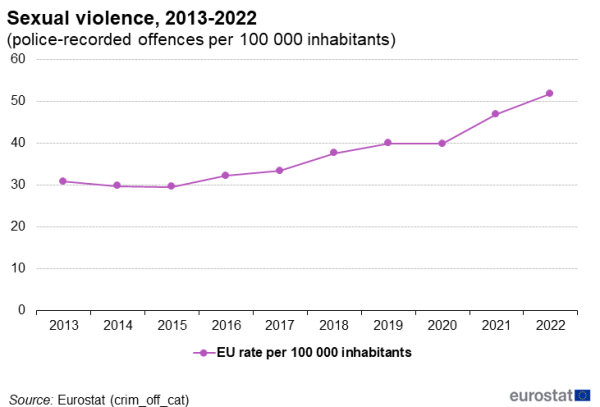
231 456 sexual violence crimes in the EU in 2022, a continued rise
In the EU, 231 456 offences of sexual violence were recorded by police in 2022, that is 10.3 % more than in the previous year. As shown in Figure 3, the trend has been on the increase since 2015, with the exception of 2020. There was an increase in the number of sexual violence offences in 2022 compared with 2021 in 21 of the 27 EU countries, while Denmark, Estonia, Croatia, Cyprus, Lithuania and Sweden recorded a decrease. In 2022, in the EU countries, the police recorded 52 offences of sexual violence per 100 000 inhabitants, compared with 47 in 2021.
(police-recorded offences per 100 000 inhabitants)
Source: Eurostat (crim_off_cat)
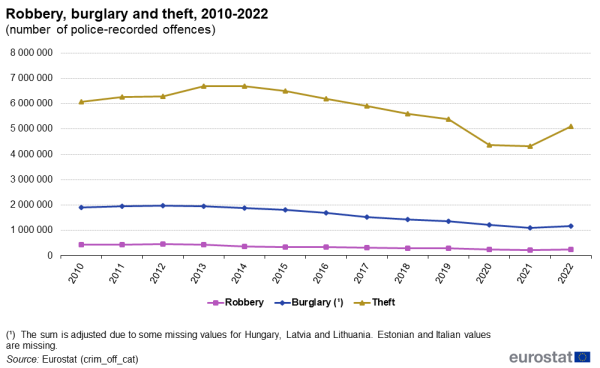
Around 5 092 500 thefts, 253 200 robberies and 1 179 600 burglaries in the EU in 2022, all increasing compared with 2021
Police-recorded thefts numbered 5 092 518 in 2022, a 17.9 % increase compared with 2021. As shown in Figure 4, the numbers increased until 2014, followed by a decrease, partly caused by a methodological break in the French series in 2016 due to a change in classification to better comply with the ICCS (International Classification of Crime for Statistical Purposes). The total number of thefts increased again in 2022 and 26 countries out of 27 registered an increase compared with the 2021 value. In 2022, 1140 thefts were recorded by the police per 100 000 inhabitants in the EU countries, an increase (+174) compared with 966 in 2021. Between 2021 and 2022, police-recorded robberies in the EU increased by 9.7 %, to 253 247. The number of robberies has been continuously decreasing since 2013, and saw a sharp decline in 2020 and 2021, then increased again in 2022. They increased in 20 out of 27 countries in 2022. In 2022, 57 robberies were recorded by the police per 100 000 inhabitants in the EU countries, a small increase (+5) compared with 52 in 2021. In the EU, police-recorded burglaries amounted to 1 179 573 in 2022. As shown in Figure 4, the number of burglaries which was generally steady until 2014, declined since 2014 and then slightly increased in 2022. The number of burglaries increased by 7.4 % compared with 2021[1]. Comparing the EU countries that provided data in 2021 and 2022, 17 countries out of 24 reported an increase. Police recorded 306 burglaries per 100 000 inhabitants in the EU countries in 2022, an increase (+22) compared with 284 in 2021.
(number of police-recorded offences)
Source: Eurostat (crim_off_cat)
Figure 5 shows the sum of robberies, burglaries and thefts in 2022 in relation to the population size (police-recorded offences per 100 000 inhabitants) and compared with the previous year. The highest figures for police-recorded offences in 2022 were observed in Sweden (3 584 per 100 000 inhabitants that means one offence per 28 persons), Luxembourg (3 255 per 100 000 inhabitants, one per 31 persons), Denmark (3 058 per 100 000 inhabitants, one offence per 33 persons), France (2 501 per 100 000 inhabitants, one per 40 persons), Finland (2 397 per 100 000 inhabitants, one per 42 persons), and Belgium (2 235 per 100 000 inhabitants, one per 45 persons), followed by six countries with between 1 300 and 1 700 robberies, burglaries and thefts per 100 000 inhabitants (Austria, Germany, Netherlands, Italy, Ireland and Slovenia), equivalent to one per 60-80 people. In nine countries the rate was between 500 and 1 000 police-recorded robberies, burglaries and thefts per 100 000 inhabitants, one every 100-200 persons, and in Croatia, Bulgaria, Romania, Lithuania, Slovakia and Cyprus the rate was below 500 per 100 000 inhabitants, one for over 200 people. The differences among countries are explained not only by the level of crime, but also by the different attitudes in reporting and recording crimes, especially minor ones.
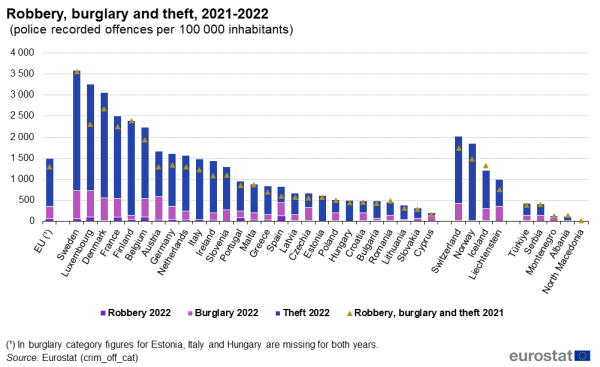
(police-recorded offences per 100 000 inhabitants)
Source: Eurostat (crim_off_cat)
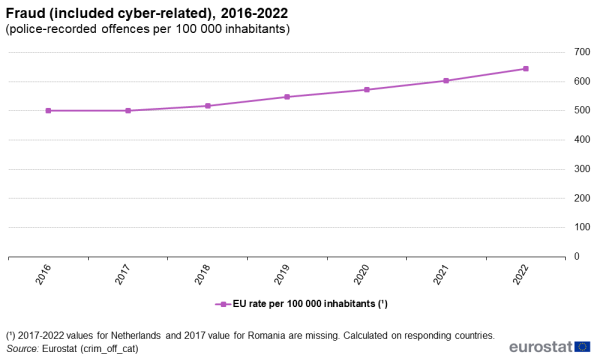
Frauds are on an increasing trend since 2016
In the EU there were 2 769 262 police-recorded frauds in 2022, with an increase of 6.9 % compared with the previous year. 19 out of 26 countries that provided the data had an increase in 2022 compared with 2021 and 13 countries recorded their highest value for the 2016-2022 period. This category also includes cyber-related frauds.
Source: Eurostat (crim_off_cat)
Source data for tables and graphs
Data sources
Statistics on crime and criminal justice systems in general
Data sources include police and other law enforcement agencies, public prosecutors, law courts, prisons, relevant ministries, and statistical offices. The national authorities are responsible for official figures that are sent to Eurostat and to the United Nations (UN Survey on Crime Trends and Operations of Criminal Justice Systems).
The data of this article
This article presents results based on official figures for police-recorded offences (criminal acts) from 2008 onwards. Eurostat updates the web database when countries send new figures, which may differ from figures presented in previous web articles. A major problem for crime statistics at European level is missing figures. Several EU totals in this article were adjusted due to this. For instance if a 2022 figure was missing, the figure for 2021 was used from same country for the same crime. In some cases, an average of the year before and after is used. Another method to deal with missing data is to compare three-year averages. For some crimes, simply too many data are missing for an EU total to be presented. The web database contains figures as reported (no adjustment).
Particular crimes
Additional data on intentional homicide, rape, and sexual assault:
Earlier data
Context
Crime statistics are used by EU institutions, national authorities, media, politicians, organisations, and the general public. Each state establishes its criminal laws, define crimes, legal proceedings and justice reactions, as well as specifications for official crime statistics (except for crimes that are covered by international or EU law). Typically, comparing crime statistics between countries is challenging due to different national criminal laws and different criminal justice systems.
However, it could also be argued that there are many similarities between European countries. This, combined with public and political interest, was the background for developing EU-wide crime statistics. Over the last decade, EU institutions, national authorities, and the UN have cooperated to improve European crime statistics. A major quality improvement is to use a common classification of crimes.
Official crime statistics mainly reflect how the authorities register and handle cases. The figures are provided by national authorities such as the police, prosecution, courts, and prisons. Of those, police figures give the broadest picture, as they include recorded offences, whether or not they led to prosecution. Still, the police records do not measure the total occurrence of crime. Simply put, the total occurrence would be the reported plus the unreported, minus the incorrectly reported. It is fair to assume that the reporting rate is high when a police record is required to support an insurance claim (e.g. car theft and burglary).
Direct access to
Notes
- ↑ In the EU total, the values for Estonia and Italy are missing and the value for Hungary is estimated from the last available year.