
27/01/17
![]()
Accessibility tools
Service tools
Language
Navigation path
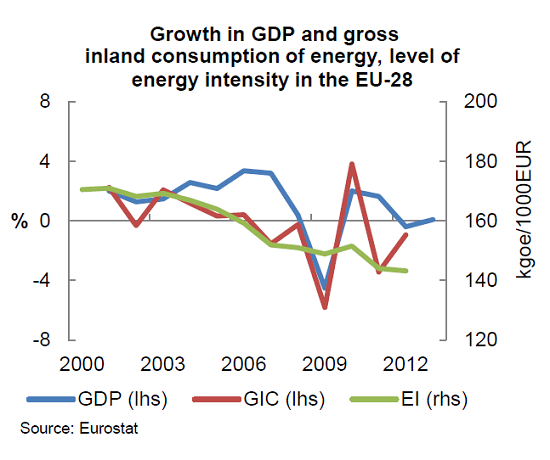
A recent European Commission staff report, Member States' Energy Dependence: An Indicator-Based Assessment, includes an in-depth analysis of energy efficiency drivers. It measures energy efficiency by energy intensity, i.e. the amount of energy needed to produce one unit of GDP.
Looking at the period 2000-2012, gross energy intensity has declined by 16% in EU-28.
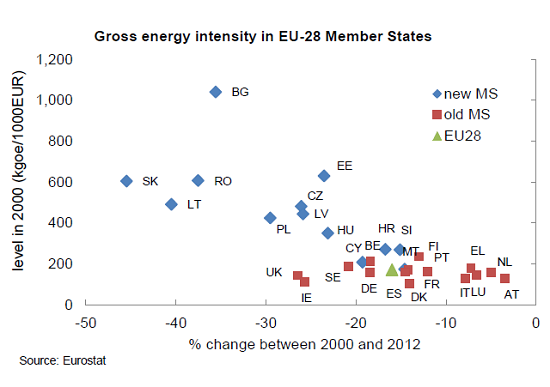
In parallel to the EU-28 development, gross energy intensity has followed a decreasing trend in all Member States.
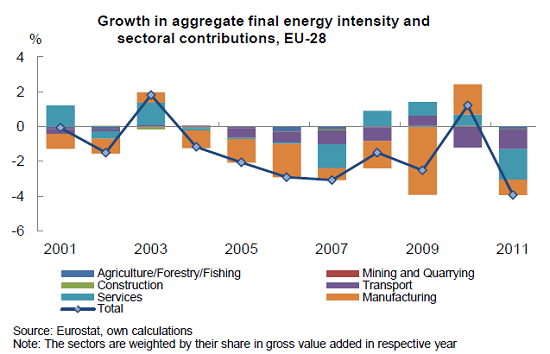
The sector which traditionally drives final energy intensity developments in the economy is manufacturing, followed by transport and services.
Energy efficiency has been closely looked at in many Member States during the 2014 European Semester, triggering country-specific recommendations in
For an in-depth analysis of Energy Efficiency drivers, read Member States' Energy Dependence: An Indicator-Based Assessment. The paper also assesses how Member States are energy dependent and potentially vulnerable to energy price hikes and supply shortages.
The performance of each of the 28 Member States is analysed and compared along each of these three dimensions:
This cross-country analysis is complemented by 10 country fiches.

Additional tools