|
|

|
|
|
| |
|
|
|
|
Statistical literacy newsletter
July 2024
|
|
|
|
|
|
|
|
|
|
|
In Focus
|
|
|
Sustainable Development Goals: where are we now?
|
|
Check out the 2024 brochure Sustainable development in the European Union and learn more about the EU's progress towards the Sustainable Development Goals. Do you want to find out how your country fares? With the interactive visualisation SDGs and me you can compare European countries with regards to living and working conditions, education, climate change, and many more aspects.
|
|
|
|
|
|
|
|
|
|
|
What's new from Eurostat
|
|
|
Key Figures on Europe: 2024 edition out now
|
|
If you are looking for basic information on Europe, this is the publication for you! With intuitive visualisations and concise text, it provides insight into the current situation and recent developments across the European countries. Dig into selected statistics focusing on people and society, economy and business, and environment and natural resources. The French and German versions will be available soon, stay tuned!
|
|
|
|
|
|
|
|
|
|
|
|
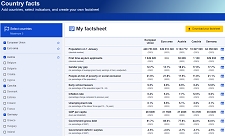
Check your facts with our country tool
|
|
Our ‘Country facts’ tool features statistical indicators on society, economy, and environment. You can choose up to 5 countries and compare them. Once you have customised your factsheet, you can download it as PDF! You can use it in presentations, for your homework or just as a small test to quiz students, friends or colleagues.
|
|
|
|
|
|
|
|
|
|
|
|
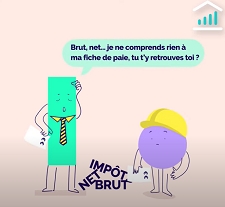
European Statistics Competition 2023-2024: and the winners are...
|
|
The winning teams from the national competitions took part in the European Statistics Competition final. The challenge? Make a two-minute video on the topic 'Everything was better before! Truth or not?'
A jury of European experts chose the top 5 videos in both age groups 14-16 and 16-18.
Watch the video to find out if students from your country are among the winners!
|
|
|
|
|
|
|
|
|
|
|
News from our network
|
|
|
|
|
Reading corner
|
|
|
Jonathan Elliott recommends
|
|
|
|
|
|
|
|
Eurostat's Education corner
If this newsletter was forwarded to you, you can subscribe to receive it directly in your inbox. | You may unsubscribe at any time. | You can review your personal data on your profile page.
|
The European Commission is committed to personal data protection. Any personal data is processed in line with the Regulation (EU) 2018/1725. Please read the privacy statement.
|
|
ISSN: 2812-0981
|
|
 |
|