Tutorials
Log in
Statistics Explained
menu
search
search
Navigation
Main page
Statistical themes
Glossary
Categories
Statistics 4 beginners
Tutorials
Help
Eurostat home
Education corner
Online publications
Regional yearbook
Sustainable development
Full list
Tools
User contributions
Logs
View user groups
Special pages
search
Navigation
Main page
Statistical themes
Glossary
Categories
Statistics 4 beginners
Tutorials
Help
Eurostat home
Education corner
Online publications
Regional yearbook
Sustainable development
Full list
Tools
User contributions
Logs
View user groups
Special pages
Navigation
Main page
Statistical themes
Glossary
Categories
Statistics 4 beginners
Tutorials
Help
Eurostat home
Education corner
Online publications
Regional yearbook
Sustainable development
Full list
Tools
User contributions
Logs
View user groups
Special pages
Uploads by Vysnave
This special page shows all uploaded files.
File list
Items per page:
20
50
100
250
500
Search for media name:
Username:
Include old versions of files
Go
First page
Previous page
Next page
Last page
Date
Name
Thumbnail
Size
Description
Versions
13:19, 2 September 2024
Climate change driving forces 2024 figures and tables finalv2.xlsx
(
file
)
726 KB
1
13:16, 2 September 2024
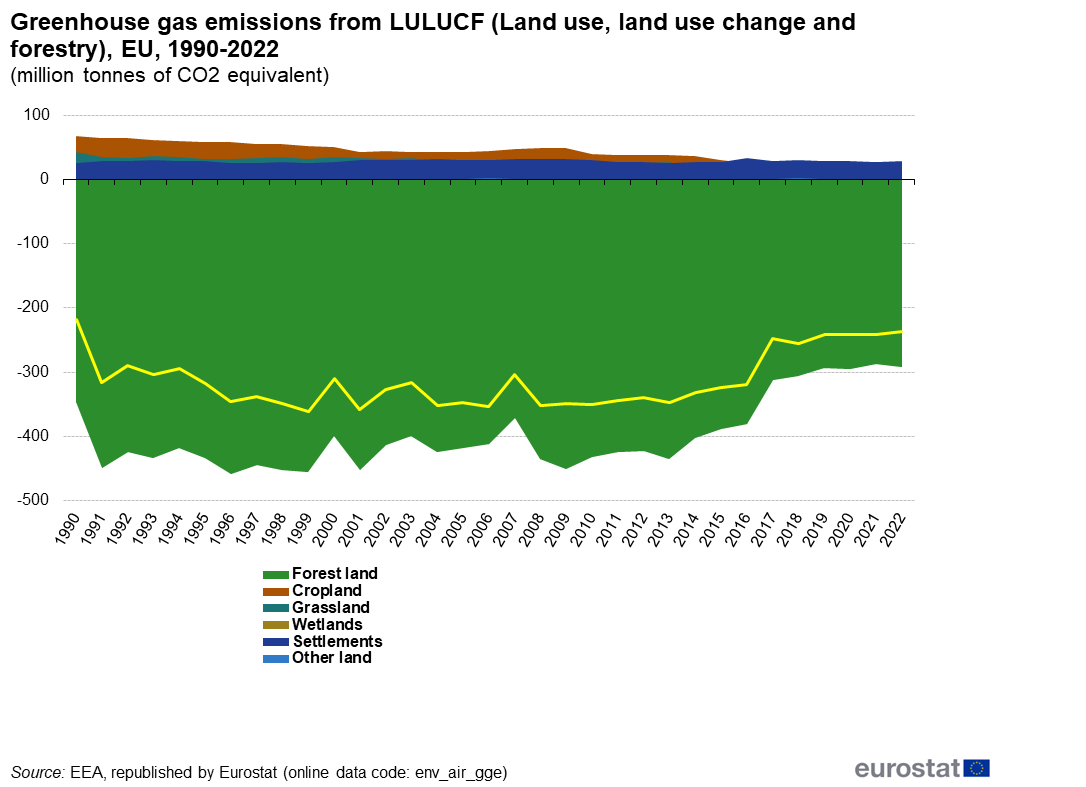
Greenhouse gas emissions from LULUCF (Land use, land use change and forestry), EU, 1990-2022 (million tonnes of CO2 equivalent) rev.png
(
file
)
57 KB
1
13:15, 2 September 2024
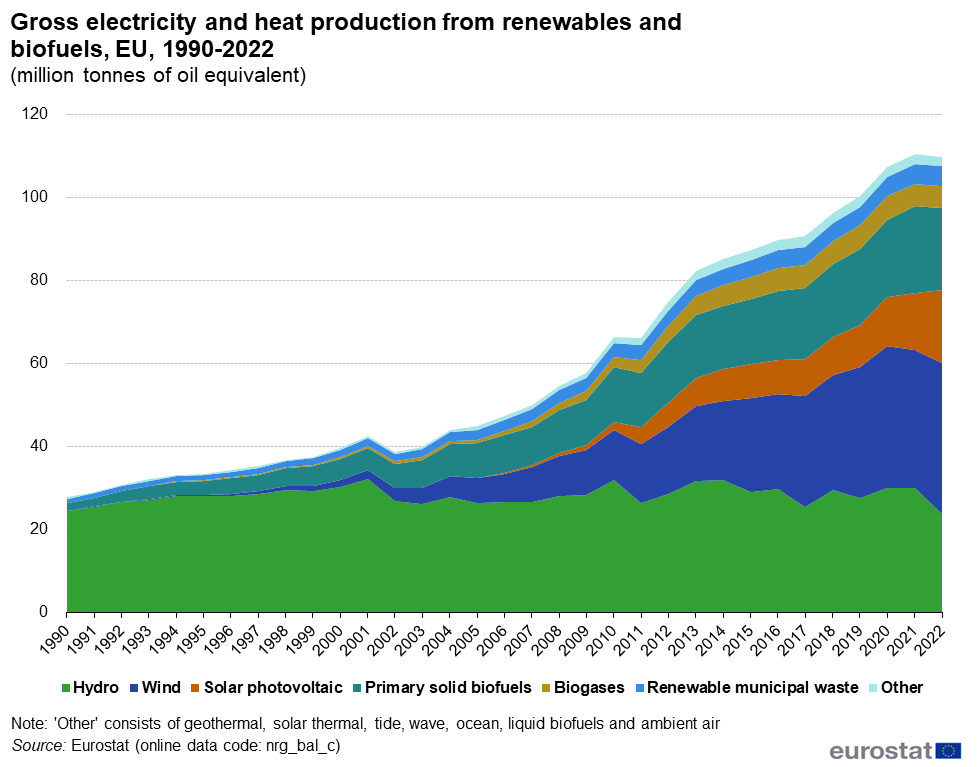
Gross electricity and heat production from renewables and biofuels, EU, 1990-2022 (million tonnes of oil equivalent) rev.png
(
file
)
57 KB
1
12:07, 2 September 2024
GHG intensity by economic activity, EU, 2008 and 2022 (grams CO2-equivalent per euro, chain linked volumes) rev.png
(
file
)
47 KB
1
12:05, 2 September 2024
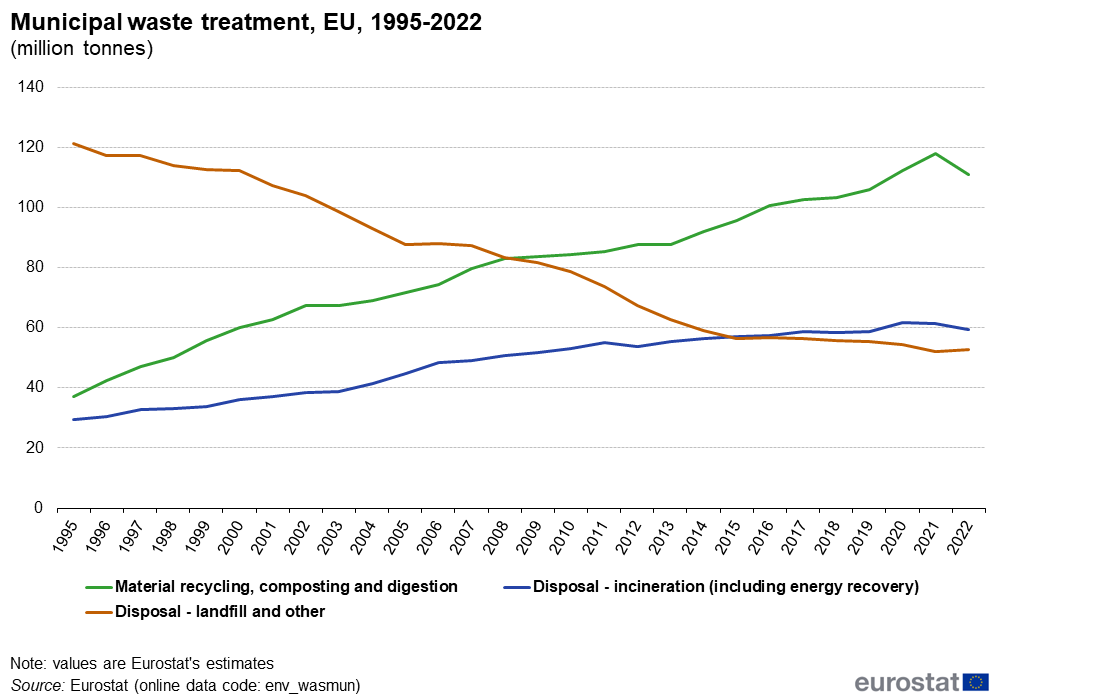
Municipal waste treatment, EU, 1995-2022 (million tonnes) rev.png
(
file
)
49 KB
1
12:04, 2 September 2024
Livestock, EU, 2001-2022 (million head) rev.png
(
file
)
33 KB
1
12:03, 2 September 2024
Greenhouse gas emissions from agriculture, EU, 1990 and 2022 (million tonnes of CO2 equivalent) rev.png
(
file
)
22 KB
1
12:02, 2 September 2024
Greenhouse gas emissions from industrial processes and product use - selected source sectors, EU, 1990 and 2022 (million tonnes of CO2 equivalent) rev.png
(
file
)
38 KB
1
12:01, 2 September 2024
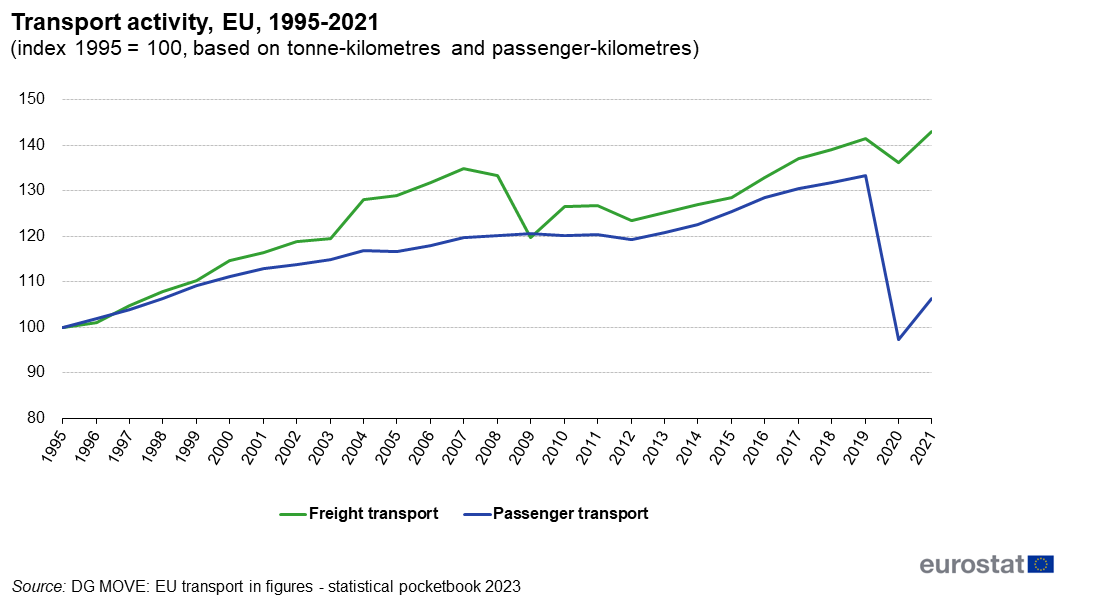
Transport activity, EU, 1995-2021 (index 1995 = 100, based on tonne-kilometres and passenger-kilometres) rev.png
(
file
)
47 KB
1
11:50, 2 September 2024
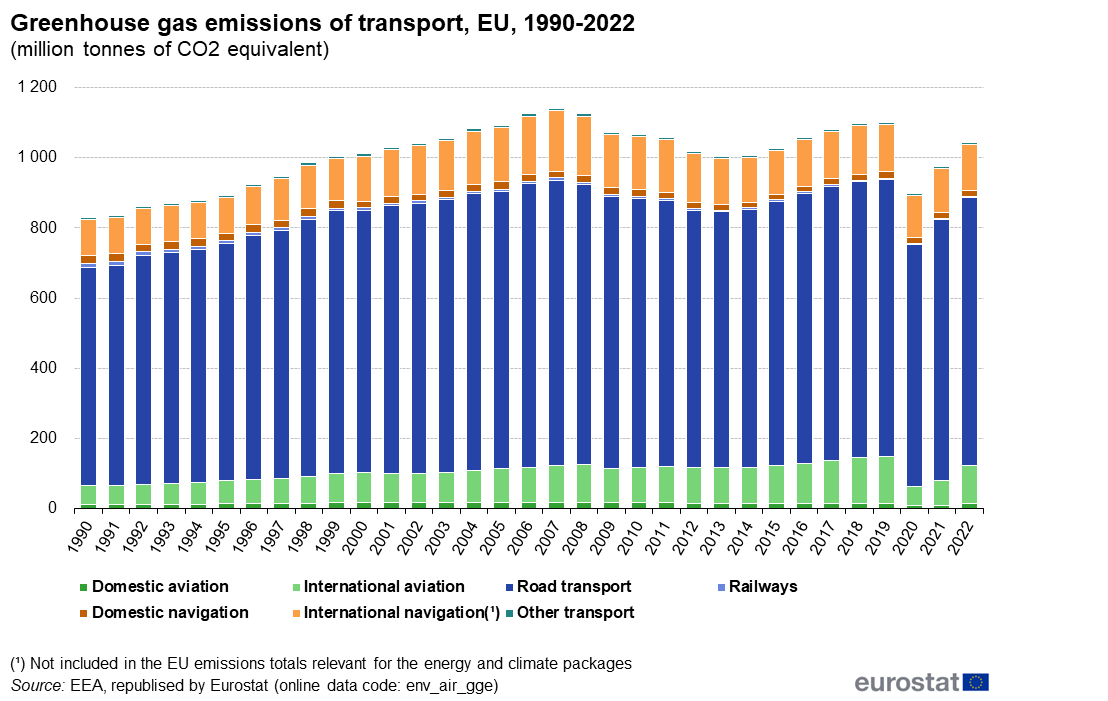
Greenhouse gas emissions of transport, EU, 1990-2022 (million tonnes of CO2 equivalent) rev.png
(
file
)
81 KB
1
11:49, 2 September 2024
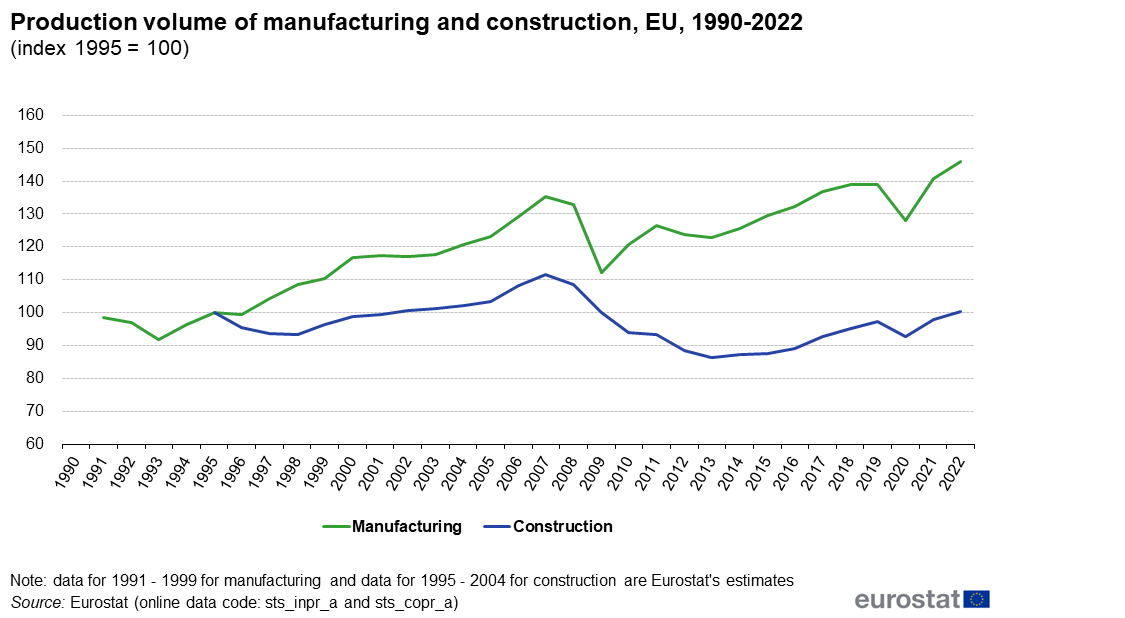
Production volume of manufacturing and construction, EU, 1990-2022 (index 1995 = 100) rev.png
(
file
)
48 KB
1
11:46, 2 September 2024
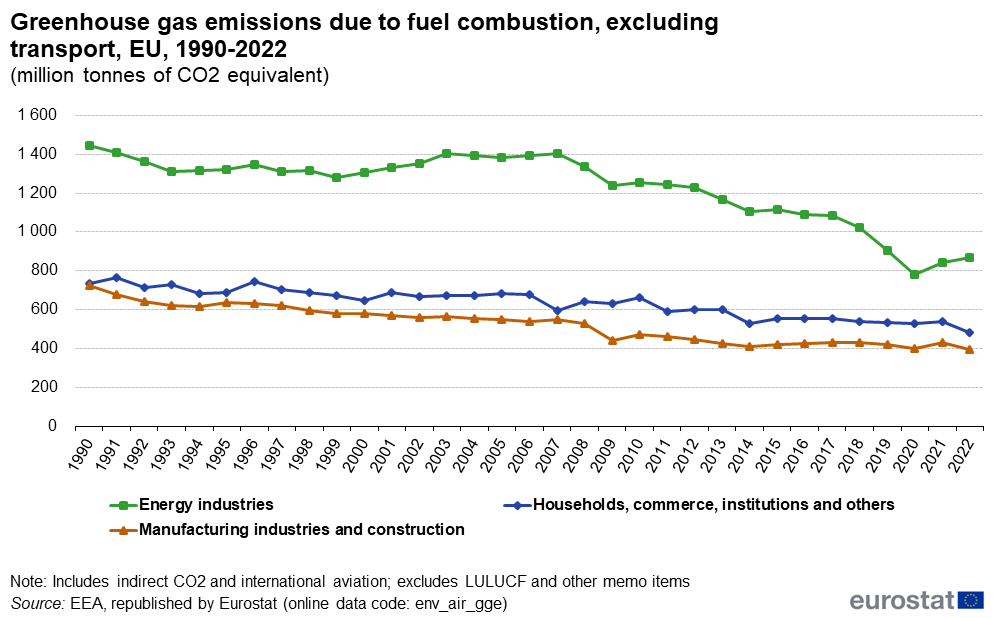
Greenhouse gas emissions due to fuel combustion, excluding transport, EU, 1990-2022 (million tonnes of CO2 equivalent) rev.png
(
file
)
51 KB
1
11:44, 2 September 2024
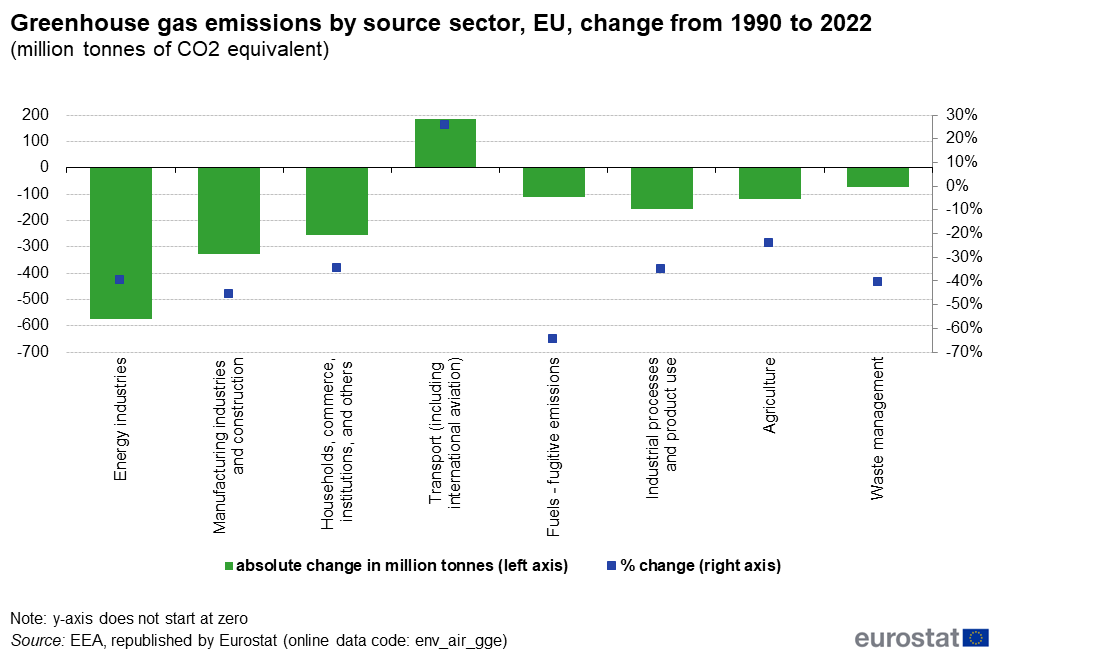
Greenhouse gas emissions by source sector, EU, change from 1990 to 2022 (million tonnes of CO2 equivalent and % change) rev.png
(
file
)
38 KB
1
11:43, 2 September 2024
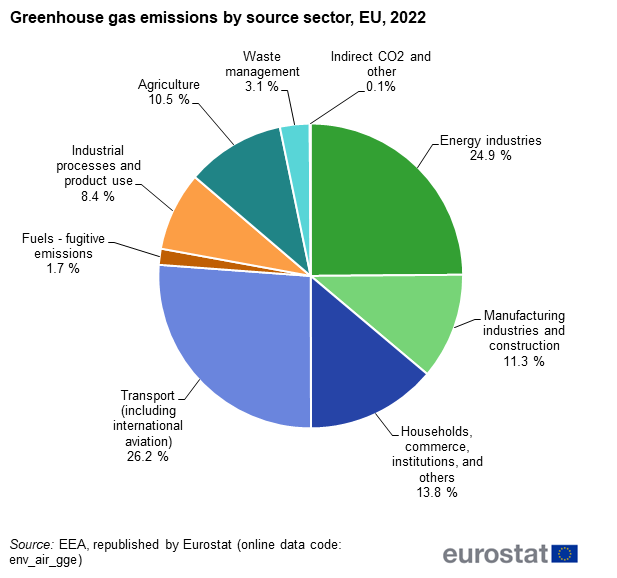
Greenhouse gas emissions by source sector, EU, 2022 rev.png
(
file
)
33 KB
1
11:42, 2 September 2024
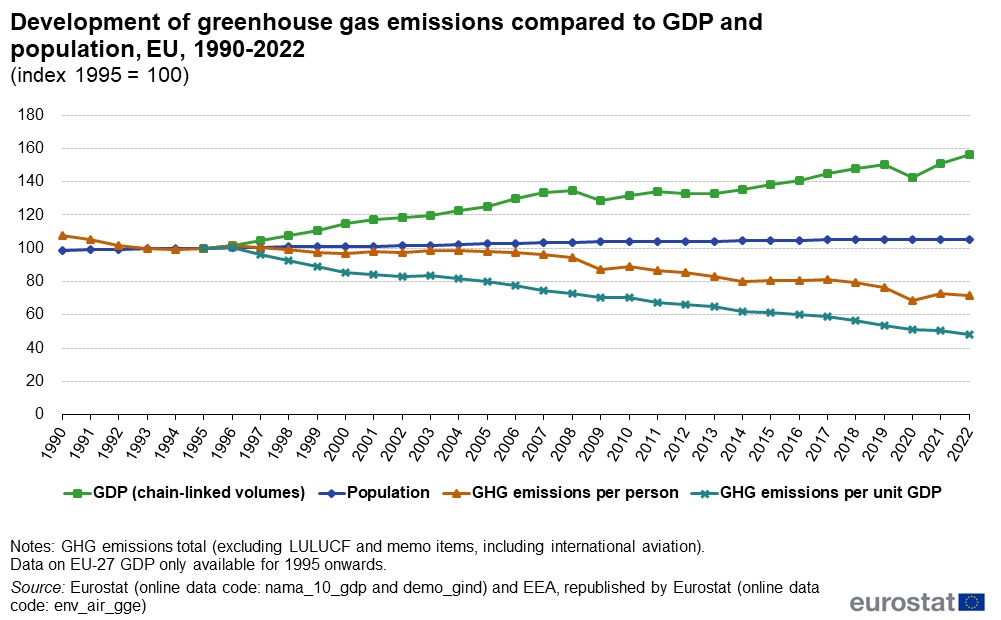
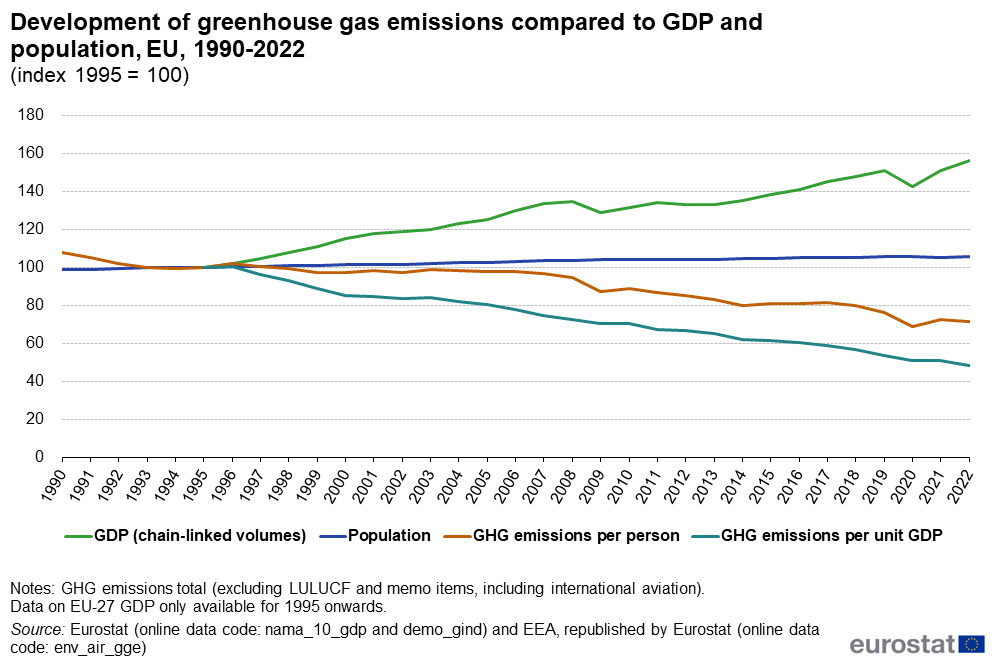
Development of greenhouse gas emissions compared to GDP and population, EU, 1990-2022 (index 1995 = 100) rev.png
(
file
)
51 KB
1
11:41, 2 September 2024
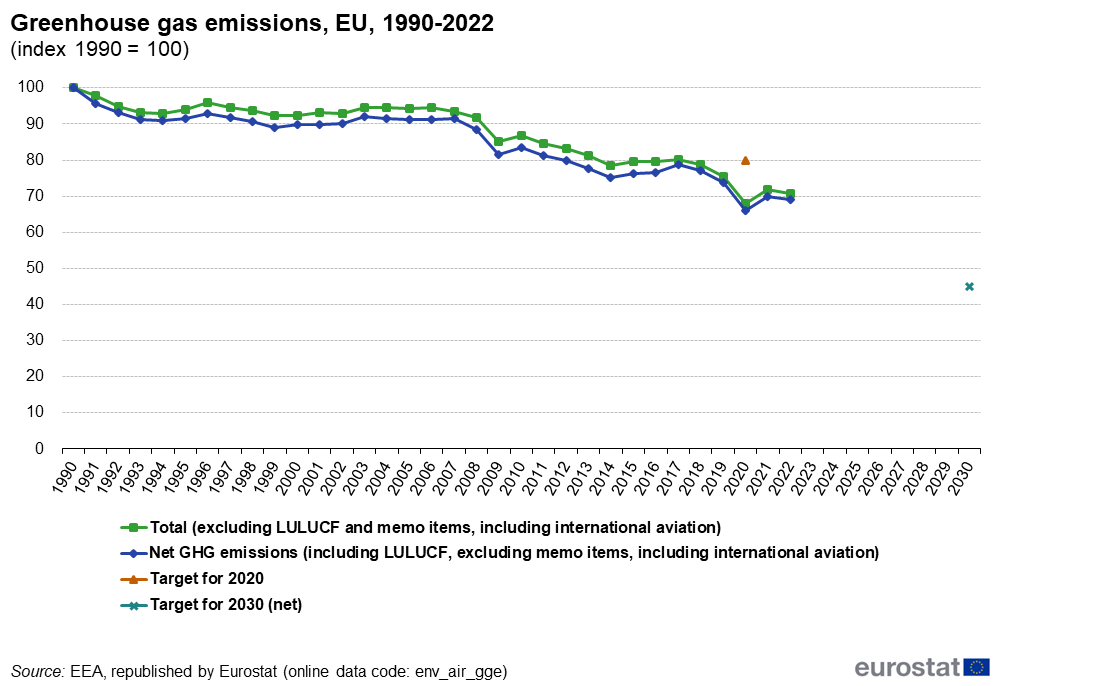
Greenhouse gas emissions, EU, 1990-2022 (index 1990 = 100) rev.png
(
file
)
51 KB
1
14:23, 29 August 2024
Greenhouse gas emissions from LULUCF (Land use, land use change and forestry), EU, 1990-2022 (million tonnes of CO2 equivalent).png
(
file
)
49 KB
1
14:13, 29 August 2024
Transport activity, EU, 1995-2021 (index 1995 = 100, based on tonne-kilometres and passenger-kilometres).png
(
file
)
44 KB
null
1
14:13, 29 August 2024
Production volume of manufacturing and construction, EU, 1990-2022 (index 1995 = 100).png
(
file
)
45 KB
null
1
14:13, 29 August 2024
Municipal waste treatment, EU, 1995-2022 (million tonnes).png
(
file
)
46 KB
null
1
14:13, 29 August 2024
Industry final energy consumption by fuel, EU, 1990 and 2022 (million tonnes of oil equivalent).png
(
file
)
28 KB
null
1
14:13, 29 August 2024
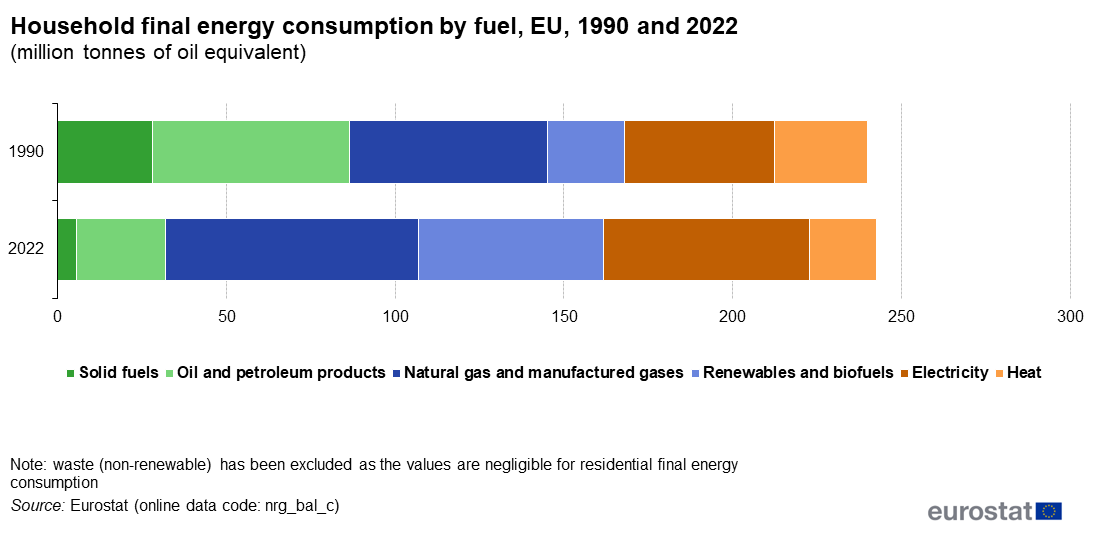
Household final energy consumption by fuel, EU, 1990 and 2022 (million tonnes of oil equivalent).png
(
file
)
30 KB
null
1
14:13, 29 August 2024
Gross electricity and heat production from renewables and biofuels, EU, 1990-2022 (million tonnes of oil equivalent).png
(
file
)
60 KB
null
1
14:13, 29 August 2024
Greenhouse gas Greenhouse gas emissions from LULUCF (Land use, land use change and forestry), EU, 1990-2022 (million tonnes of CO2 equivalent).png
(
file
)
49 KB
null
1
14:13, 29 August 2024
Greenhouse gas emissions of waste management, EU, 1990-2022 (million tonnes of CO2 equivalent).png
(
file
)
64 KB
null
1
14:13, 29 August 2024
Greenhouse gas emissions of transport, EU, 1990-2022 (million tonnes of CO2 equivalent).png
(
file
)
64 KB
null
1
14:13, 29 August 2024
Greenhouse gas emissions from industrial processes and product use - selected source sectors, EU, 1990 and 2022 (million tonnes of CO2 equivalent).png
(
file
)
38 KB
null
1
14:13, 29 August 2024
Greenhouse gas emissions from agriculture, EU, 1990 and 2022 (million tonnes of CO2 equivalent).png
(
file
)
25 KB
null
1
14:13, 29 August 2024
Greenhouse gas emissions due to fuel combustion, excluding transport, EU, 1990-2022 (million tonnes of CO2 equivalent).png
(
file
)
51 KB
null
1
14:13, 29 August 2024
Greenhouse gas emissions, EU, 1990-2022 (index 1990 = 100).png
(
file
)
41 KB
null
1
14:13, 29 August 2024
Greenhouse gas emissions by source sector, EU, change from 1990 to 2022 (million tonnes of CO2 equivalent and % change).png
(
file
)
51 KB
null
1
14:13, 29 August 2024
Greenhouse gas emissions by source sector, EU, 2022.png
(
file
)
42 KB
null
1
14:13, 29 August 2024
Greenhouse gas emissions by gas type in CO2-equivalents, EU, 2022.png
(
file
)
25 KB
null
1
14:13, 29 August 2024
Greenhouse gas emissions by economic activity according to the NACE classification, EU, 2022.png
(
file
)
39 KB
null
1
14:13, 29 August 2024
Greenhouse gas emissions by country, absolute change 1990-2022 (million tonnes).png
(
file
)
45 KB
null
1
14:13, 29 August 2024
GHG intensity by economic activity, EU, 2008 and 2022 (grams CO2-equivalent per euro, chain linked volumes).png
(
file
)
47 KB
null
1
14:13, 29 August 2024
Electricity and heat production by fuel, EU, 1990 and 2022 (million tonnes of oil equivalent).png
(
file
)
35 KB
null
1
14:13, 29 August 2024
Development of greenhouse gas emissions compared to GDP and population, EU, 1990-2022 (index 1995 = 100).png
(
file
)
49 KB
null
1
14:13, 29 August 2024
Climate change driving forces 2024 figures and tables final.xlsx
(
file
)
727 KB
null
1
14:44, 19 December 2022
Forests forestry and logging statistics 20 12 2022.xlsx
(
file
)
120 KB
1
14:16, 19 December 2022
Figure 4 Employment per area of forest, 2000 and 2020 (persons employed 1 000 ha).png
(
file
)
67 KB
1
13:01, 19 December 2022
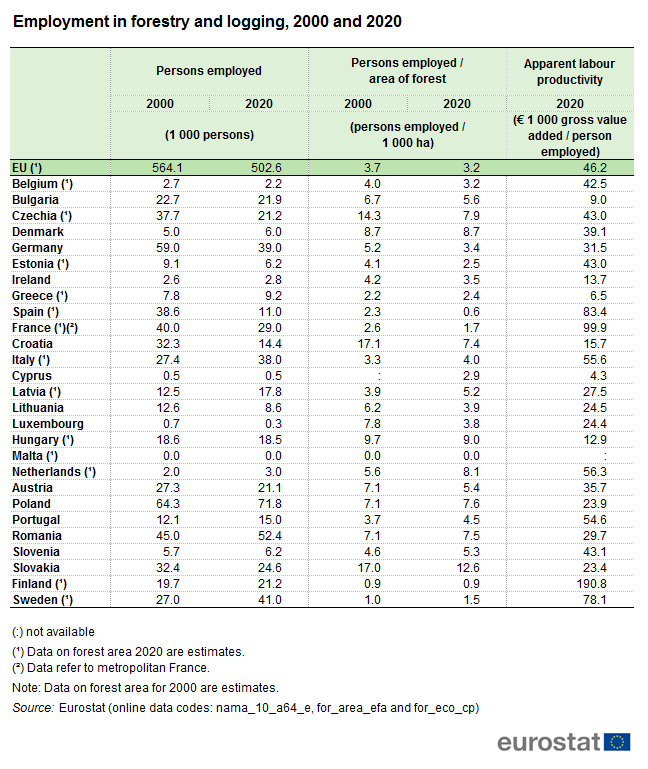
Table 2 Employment in forestry and logging, 2000 and 2020.png
(
file
)
58 KB
1
11:27, 19 December 2022
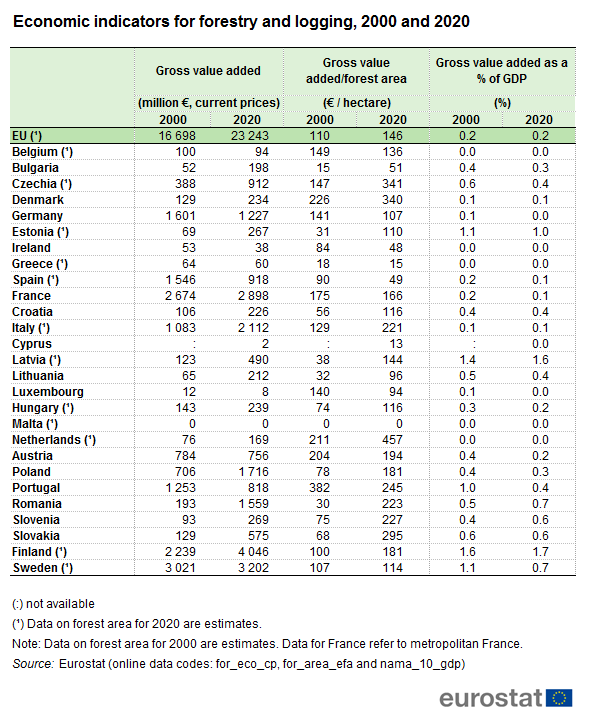
Table 1 Economic indicators for forestry and logging, 2000 and 2020.png
(
file
)
57 KB
1
10:36, 19 December 2022
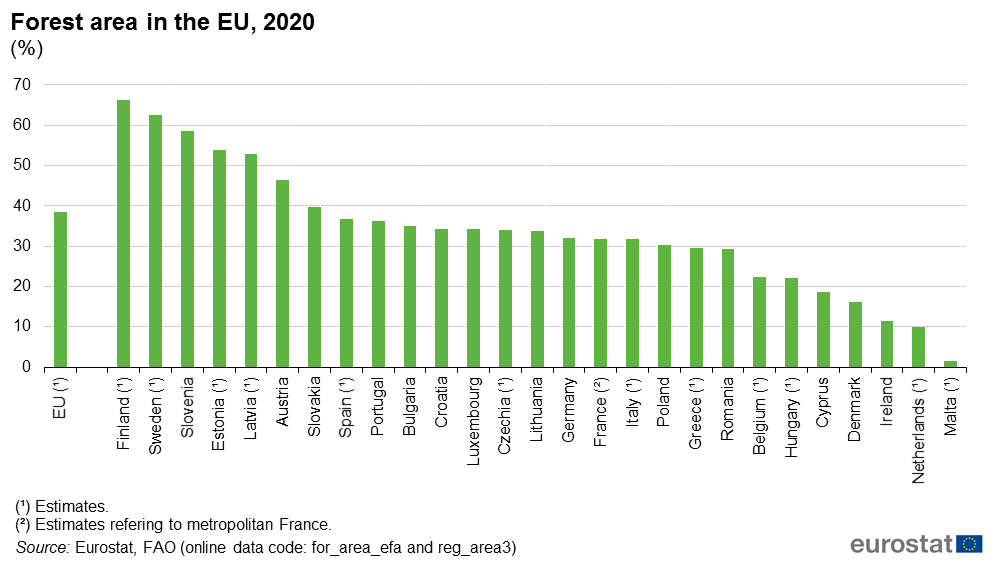
Figure 1 Forest area in the EU, 2020 (%).png
(
file
)
57 KB
1
16:54, 18 December 2022
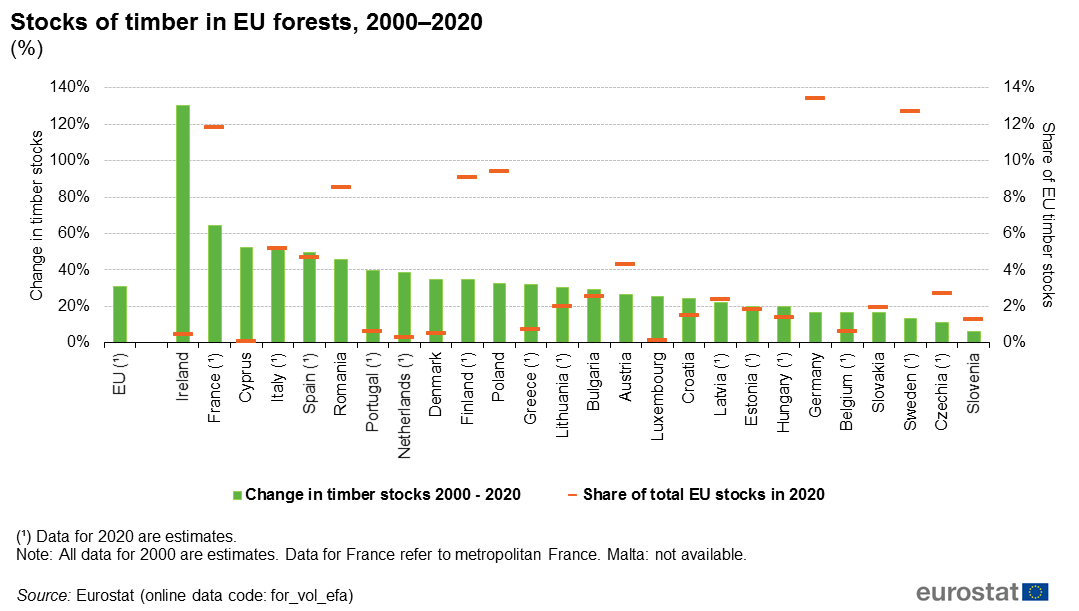
Figure 2 Stocks of timber in EU forests, 2000–2020 (%).png
(
file
)
60 KB
1
15:27, 18 December 2022
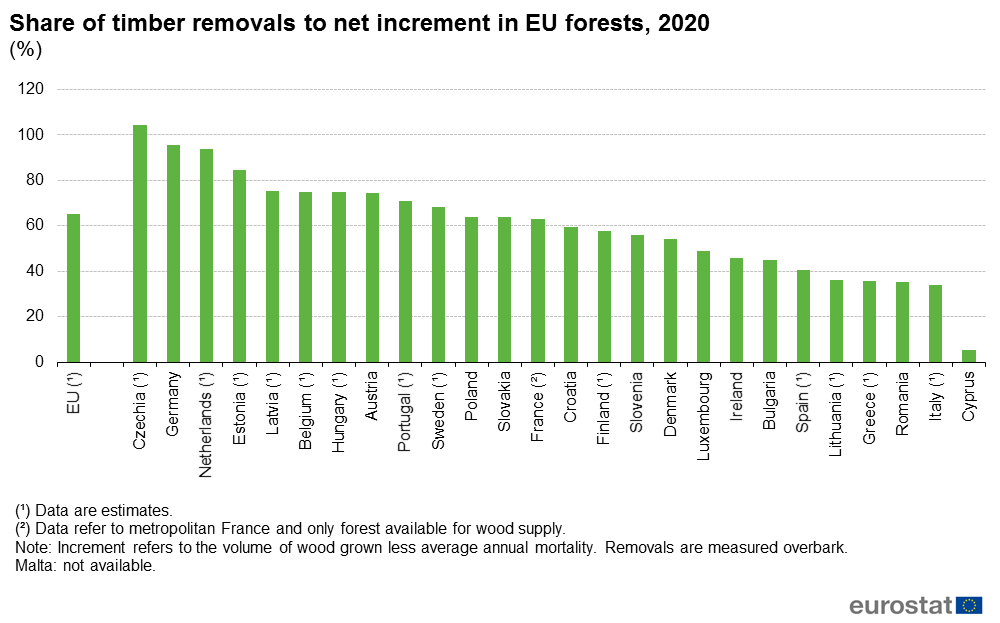
Figure 3 Share of timber removals to net increment in EU forests, 2020 (%).png
(
file
)
67 KB
1
15:52, 28 February 2022
Biodiversity 2022 03 04.xlsx
(
file
)
79 KB
1
15:50, 28 February 2022
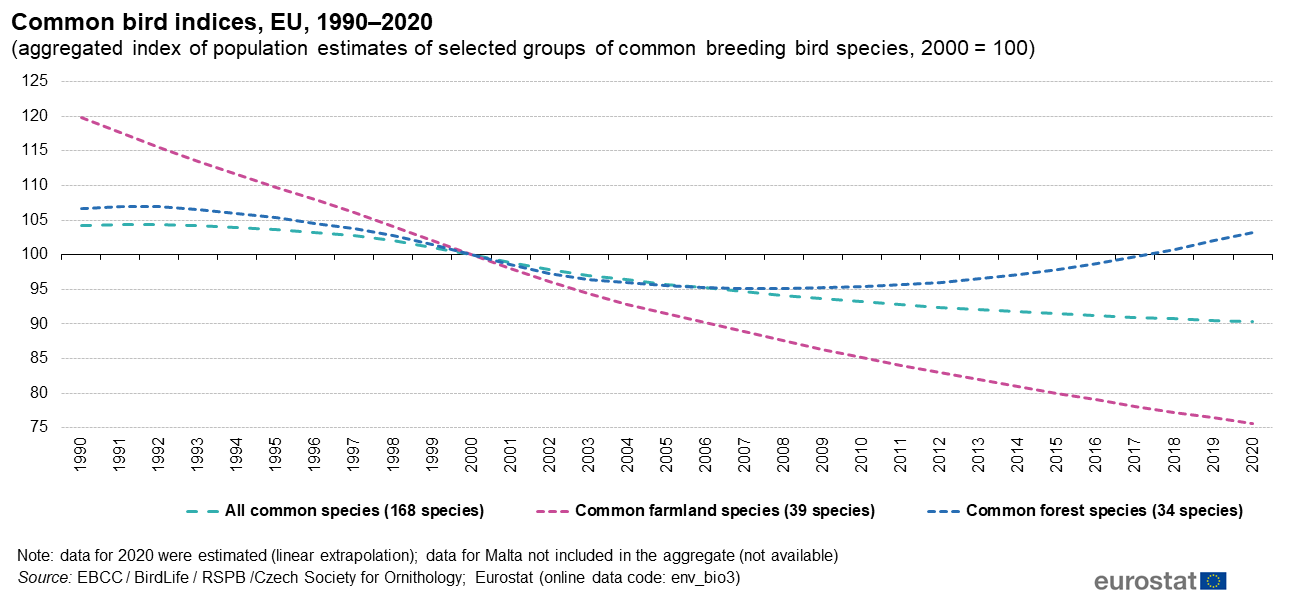
Common bird indices, EU, 1990–2020 (2000 = 100).png
(
file
)
64 KB
1
17:26, 21 December 2021
Forests forestry and logging statistics 20 12 2021.xlsx
(
file
)
135 KB
4
17:25, 21 December 2021
Figure 4 Forestry and logging gross value added per area of forest, 2000 and 2019 (€ hectare, current prices).png
(
file
)
71 KB
2
First page
Previous page
Next page
Last page
Special page
ISSN 2443-8219
,_EU,_1990-2022_(million_tonnes_of_CO2_equivalent)_rev.png)
_rev.png)
_rev.png)
_rev.png)
_rev.png)
_rev.png)
_rev.png)
_rev.png)
_rev.png)
_rev.png)
_rev.png)
_rev.png)

_rev.png)
_rev.png)
,_EU,_1990-2022_(million_tonnes_of_CO2_equivalent).png)
.png)
.png)
.png)
.png)
.png)
.png)
,_EU,_1990-2022_(million_tonnes_of_CO2_equivalent).png)
.png)
.png)
.png)
.png)
.png)
.png)
.png)


.png)
.png)
.png)
.png)
.png)


.png)
.png)
.png)
.png)
.png)