Tutorials
Log in
Statistics Explained
menu
search
search
Navigation
Main page
Statistical themes
Glossary
Categories
Statistics 4 beginners
Tutorials
Help
Eurostat home
Education corner
Online publications
Regional yearbook
Sustainable development
Full list
Tools
User contributions
Logs
View user groups
Special pages
search
Navigation
Main page
Statistical themes
Glossary
Categories
Statistics 4 beginners
Tutorials
Help
Eurostat home
Education corner
Online publications
Regional yearbook
Sustainable development
Full list
Tools
User contributions
Logs
View user groups
Special pages
Navigation
Main page
Statistical themes
Glossary
Categories
Statistics 4 beginners
Tutorials
Help
Eurostat home
Education corner
Online publications
Regional yearbook
Sustainable development
Full list
Tools
User contributions
Logs
View user groups
Special pages
Uploads by Krukoma
This special page shows all uploaded files.
File list
Items per page:
20
50
100
250
500
Search for media name:
Username:
Include old versions of files
Go
First page
Previous page
Next page
Last page
Date
Name
Thumbnail
Size
Description
Versions
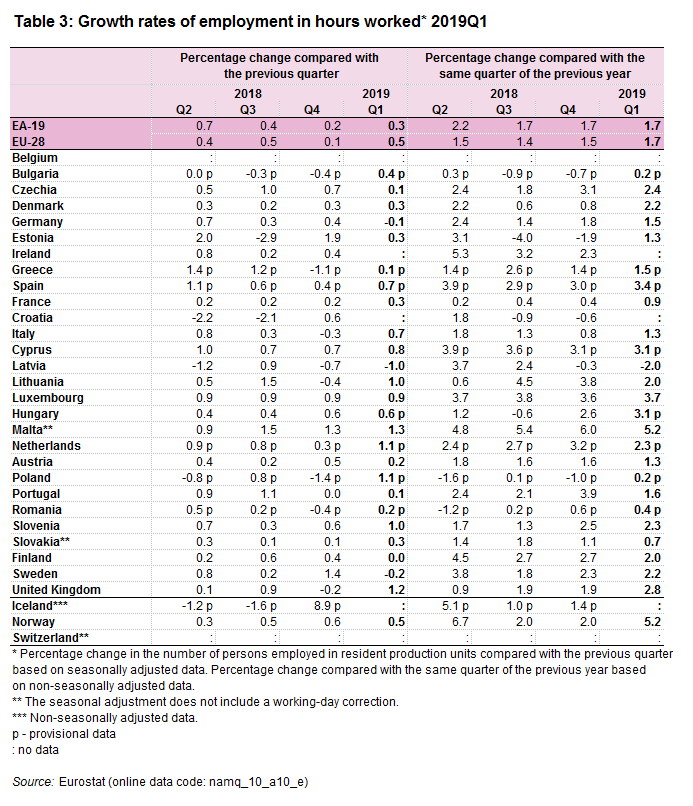
11:24, 8 July 2019
Growth rates of employment in hours worked 2019Q1.png
(
file
)
49 KB
1
15:02, 4 July 2019
Fig6-Changes to operating surplus and mixed income, gross as a percentage of GDP between 1998 and 2018.png
(
file
)
21 KB
1
15:01, 4 July 2019
Fig5-Changes to tax on prod and import 1998-2018.png
(
file
)
23 KB
1
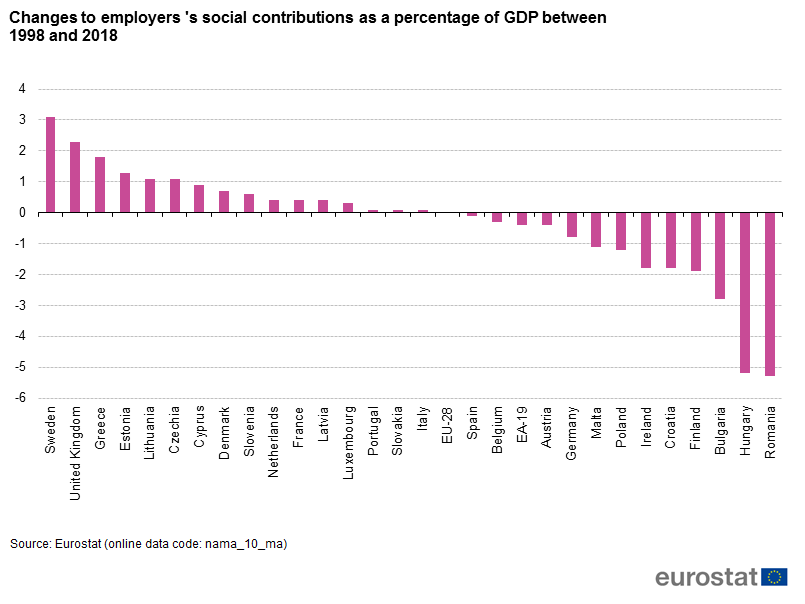
15:00, 4 July 2019
Fig4-Changes to empl social contrib 1998-2018.png
(
file
)
23 KB
1
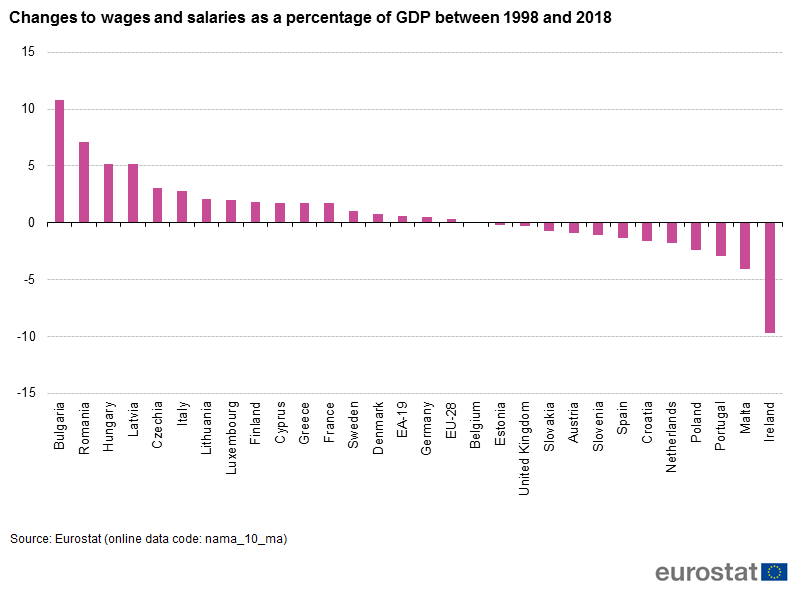
14:58, 4 July 2019
Fig3-Changes to wages and salaries as a percentage of GDP between 1998 and 2018.png
(
file
)
21 KB
1
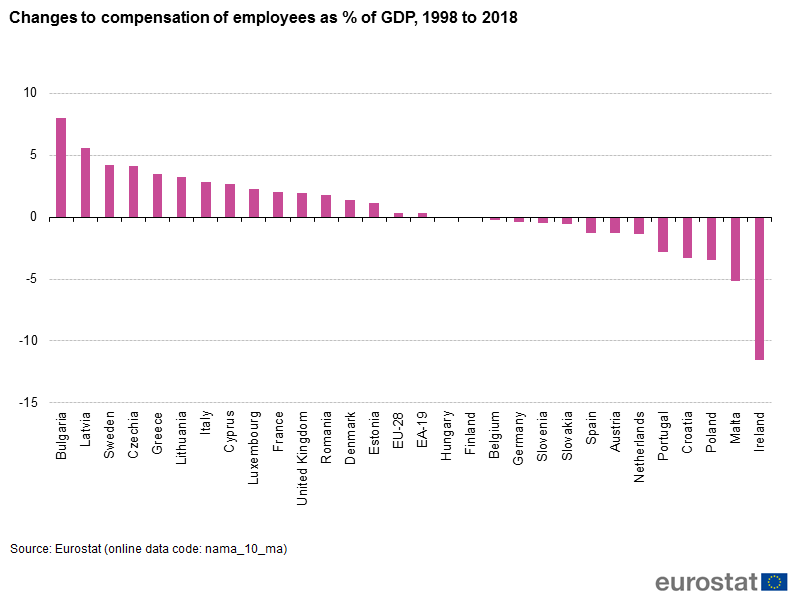
14:56, 4 July 2019
Fig2-Changes to comp of empl 1998-2018.png
(
file
)
21 KB
1
14:52, 4 July 2019
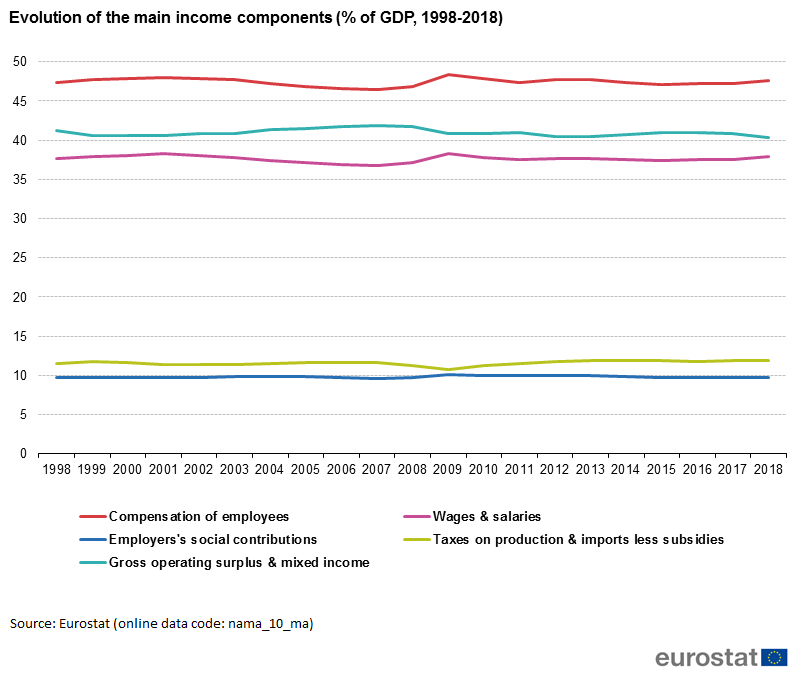
Fig7-Evolution of the main income components (% of GDP, 1998-2018).png
(
file
)
24 KB
1
14:50, 4 July 2019
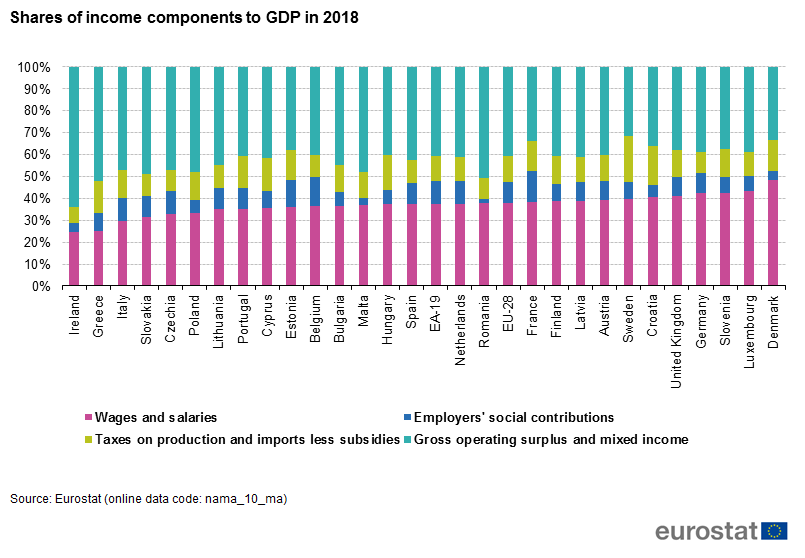
Fig1-Shares of income components to GDP in 2018.png
(
file
)
45 KB
1
14:48, 4 July 2019
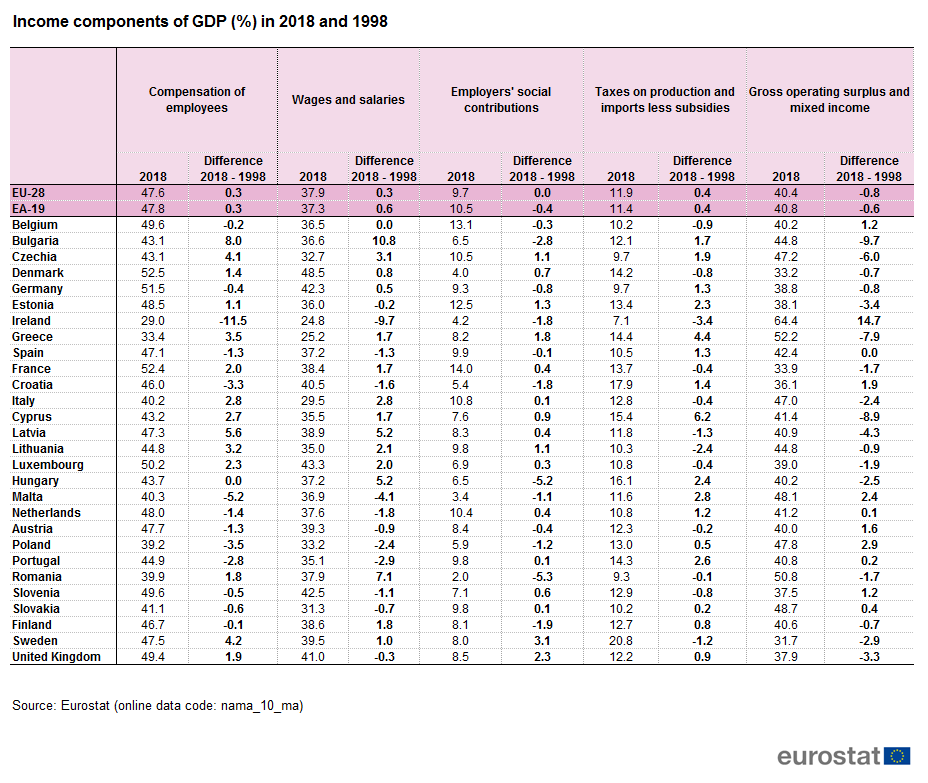
Tab1-Income components of GDP (%) in 2018 and 1998.png
(
file
)
64 KB
1
14:17, 11 April 2019
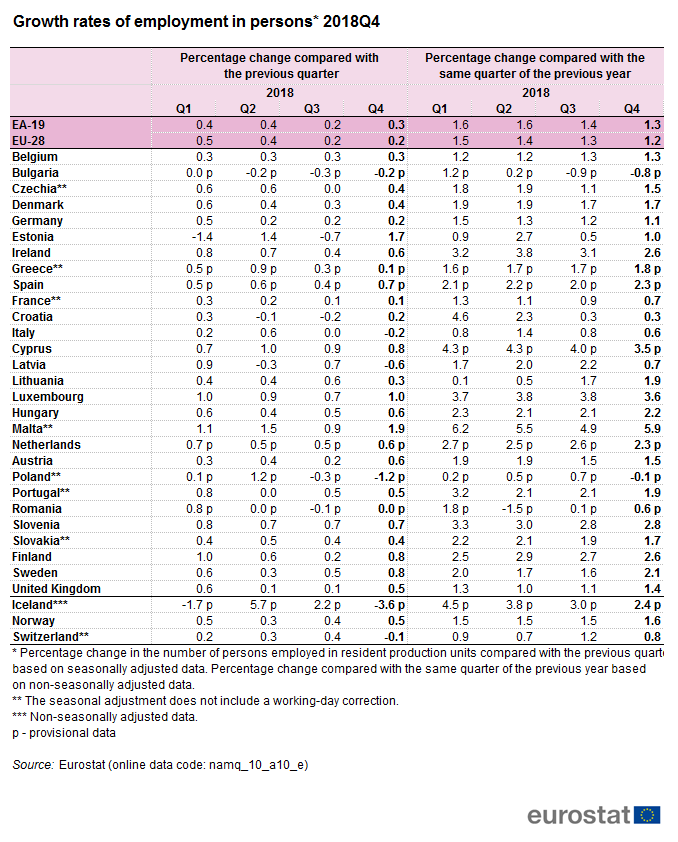
Growth rates of employment in persons 2018Q4.png
(
file
)
54 KB
1
14:03, 11 April 2019
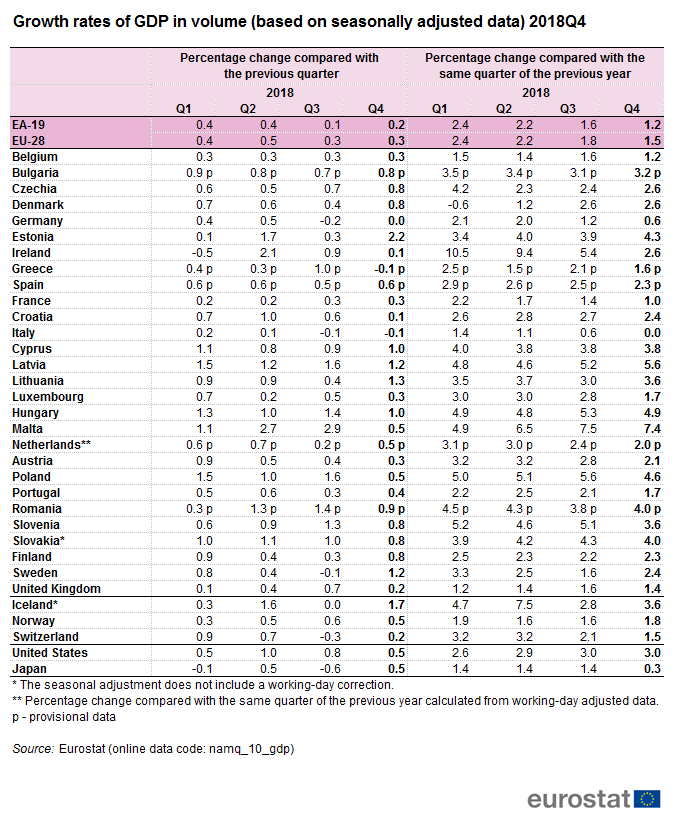
Growth rates of GDP in volume (based on seasonally adjusted data) 2018Q4.png
(
file
)
54 KB
1
11:30, 9 April 2019
EU28 GDP, productivity and unit labour costs, annual growth rates in %, 2007-2018.png
(
file
)
27 KB
1
13:42, 23 November 2018
Figure3 Table Implicit-deflator 2008-2017.xlsx
(
file
)
14 KB
2
13:40, 23 November 2018
Figure2 Table Volumes 2008-2017.xlsx
(
file
)
12 KB
1
13:38, 23 November 2018
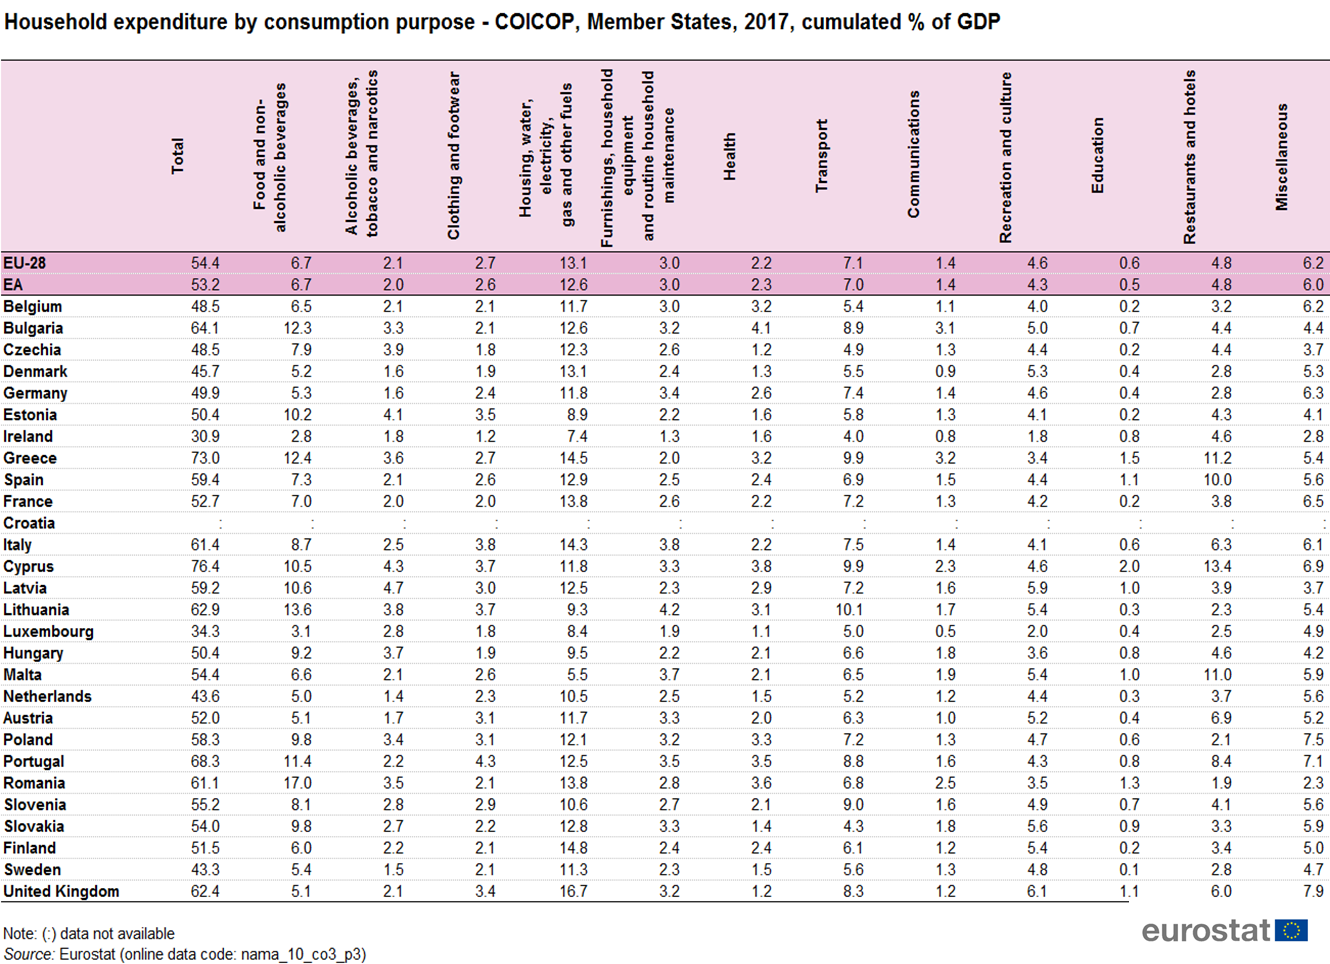
Household expenditure by consumption purpose - COICOP, Member States, 2017, cumulated % of GDP.png
(
file
)
496 KB
1
13:37, 23 November 2018
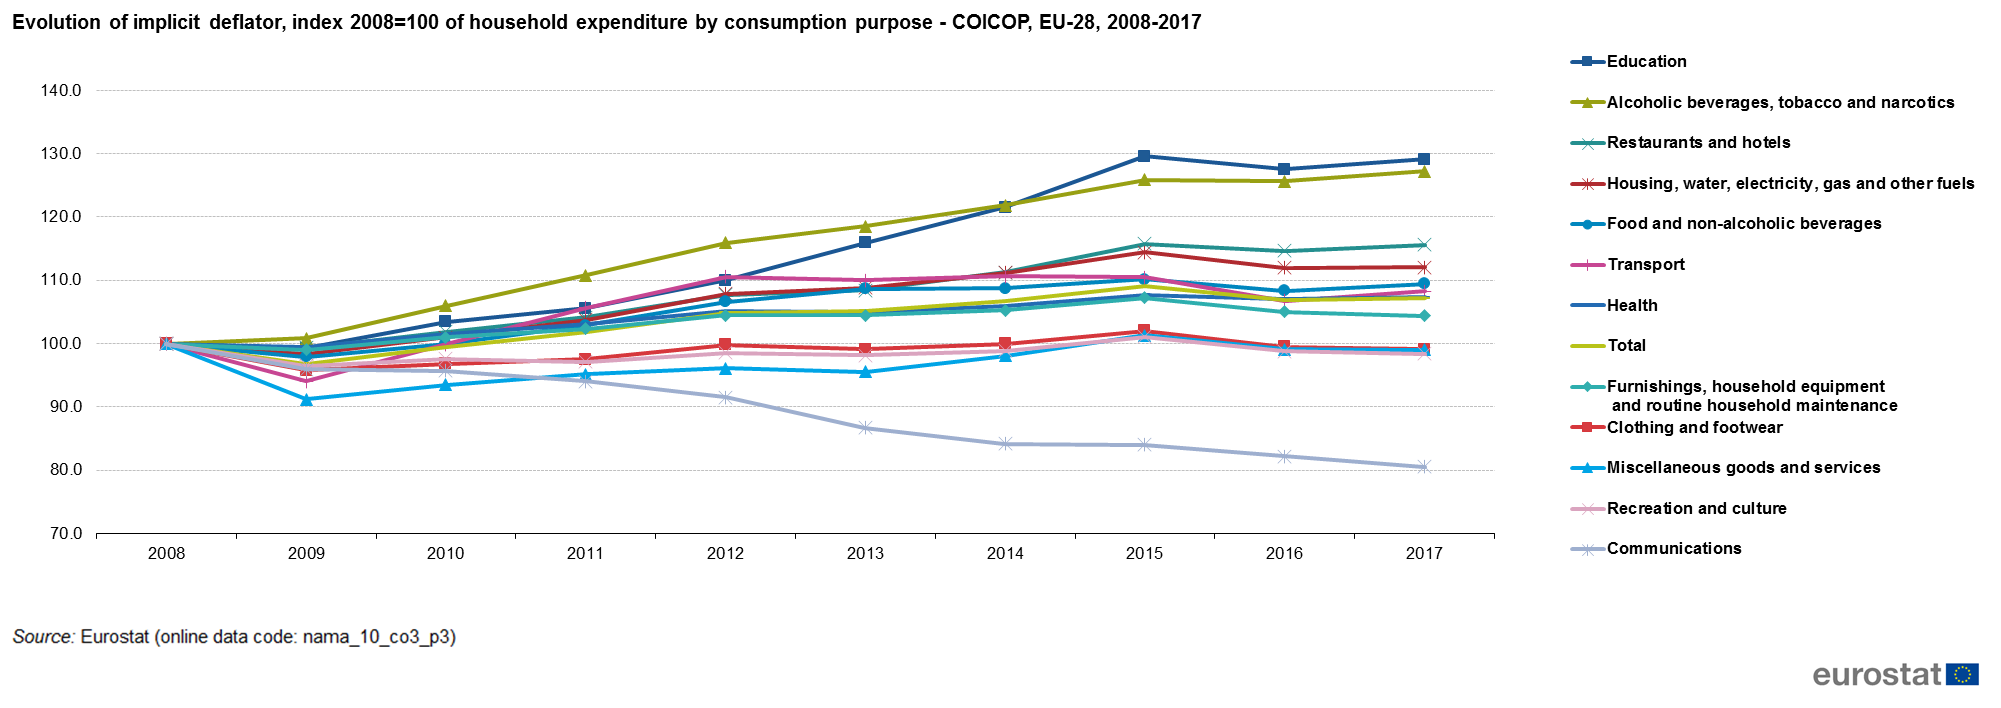
Evolution of implicit deflator, index 2008=100 of COICOP, EU-28, 2008-2017.png
(
file
)
128 KB
1
13:35, 23 November 2018
Evolution of chain linked volumes, index 2008=100 of COICOP, EU-28, 2008-2017.png
(
file
)
124 KB
1
16:27, 22 November 2018
Figure 3-Implicit deflator 2005-2017.xlsx
(
file
)
15 KB
1
16:25, 22 November 2018
Figure 2-Volumes 2005-2017.xlsx
(
file
)
12 KB
1
16:19, 22 November 2018
Fig2-Volumes.2005-2017.xlsx
(
file
)
37 KB
1
16:08, 22 November 2018
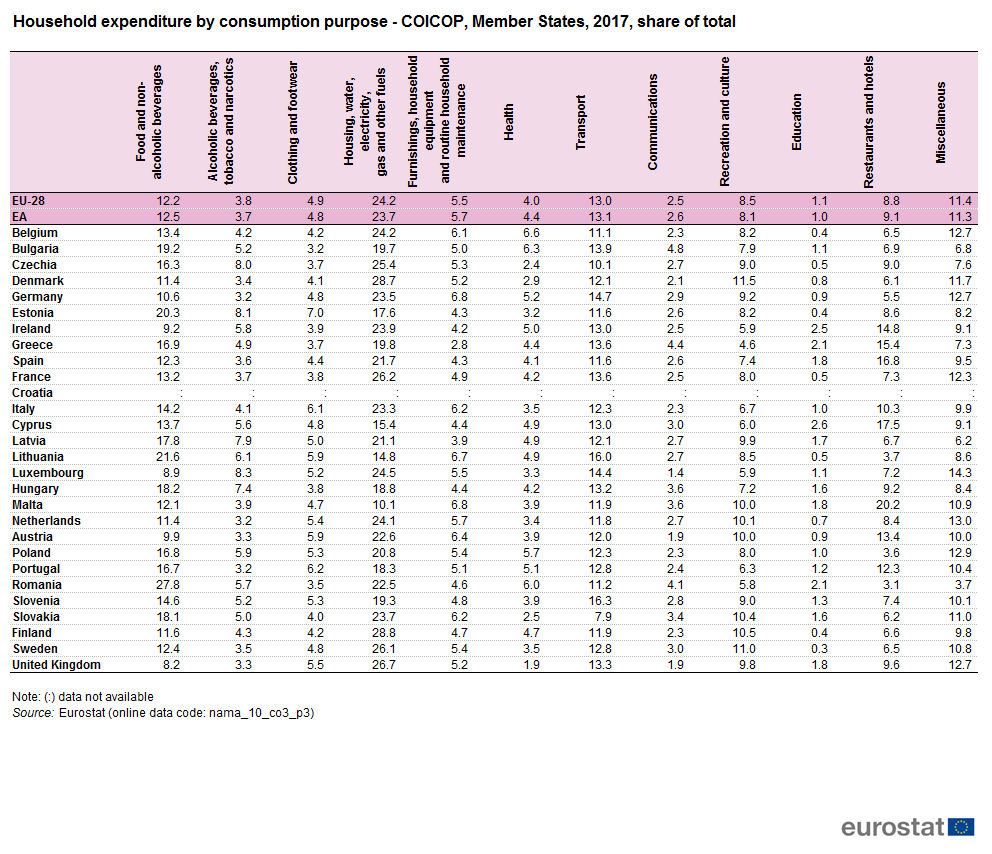
Household expenditure by consumption purpose - COICOP, Member States, 2017, share of total.png
(
file
)
59 KB
1
16:04, 22 November 2018
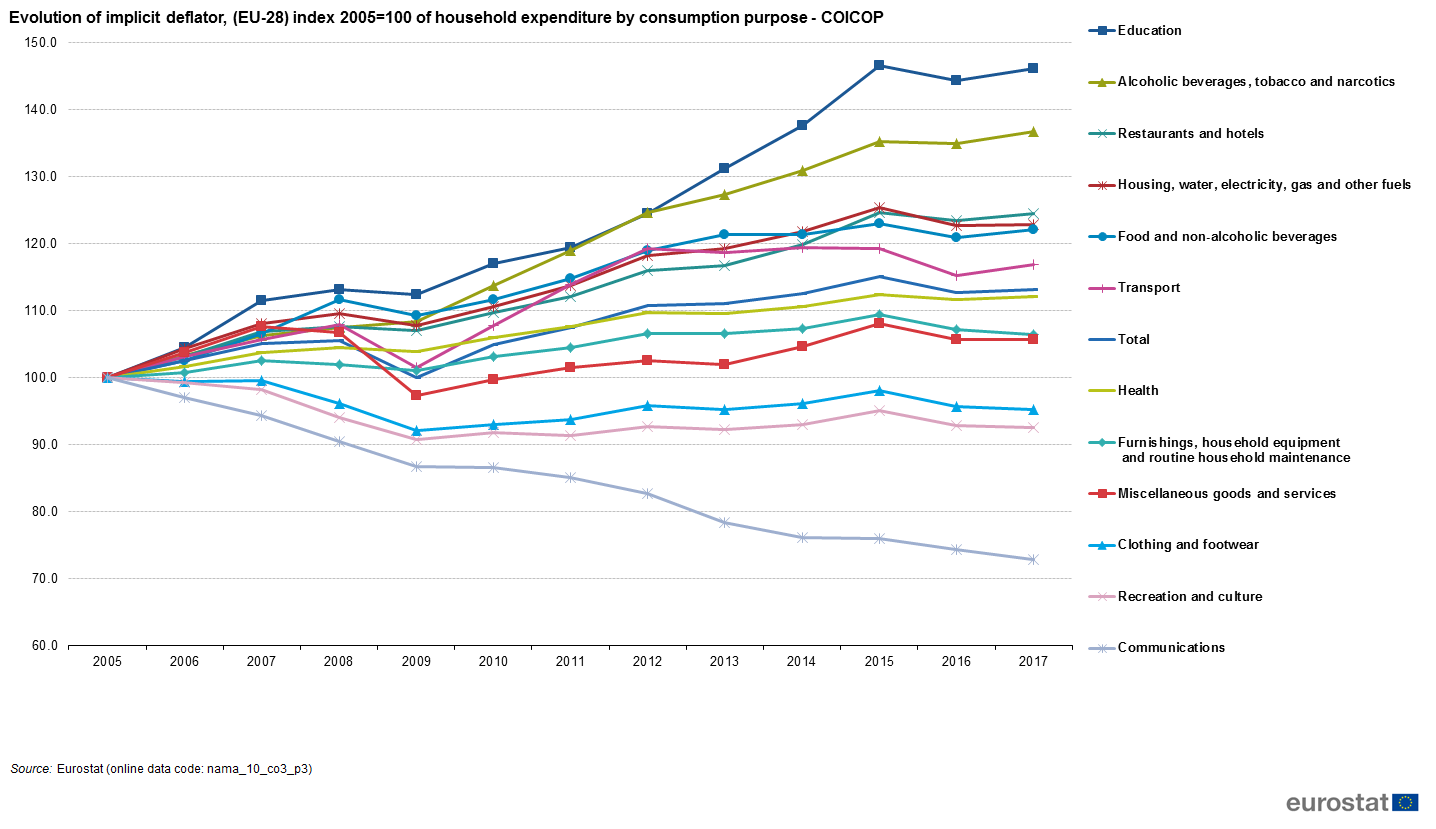
Evolution of implicit deflator, (EU-28) index 2005=100 of household expenditure by consumption purpose - COICOP.png
(
file
)
86 KB
1
16:00, 22 November 2018
Evolution of chain linked volumes (EU-28) index 2005=100 of household expenditure by consumption purpose - COICOP.png
(
file
)
68 KB
1
15:56, 22 November 2018
Evolution of chain linked volumes, index 2005=100 of household expenditure by consumption purpose - COICOP, EU-28.png
(
file
)
68 KB
2
15:50, 22 November 2018
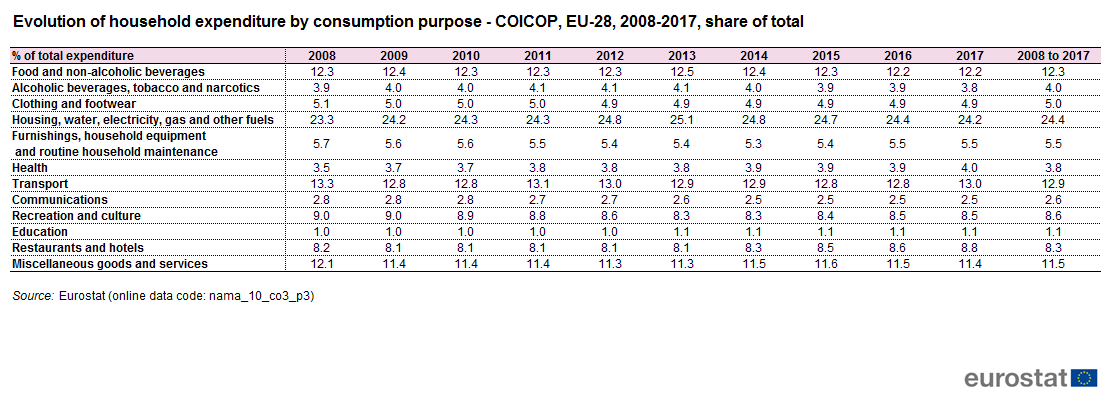
Evolution of household expenditure by consumption purpose - COICOP, EU-28, 2008-2017, share of total.png
(
file
)
29 KB
1
15:47, 22 November 2018
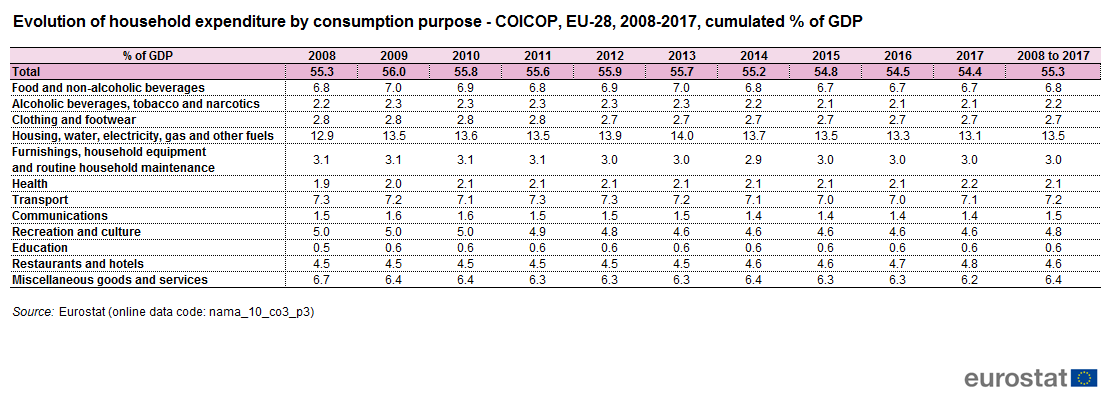
Evolution of household expenditure by consumption purpose - COICOP, EU-28, 2008-2017, cumulated % of GDP.png
(
file
)
30 KB
1
15:44, 22 November 2018
Household expenditure by consumption purpose - COICOP, EU-28, 2017, share of total.png
(
file
)
39 KB
1
15:09, 11 October 2018
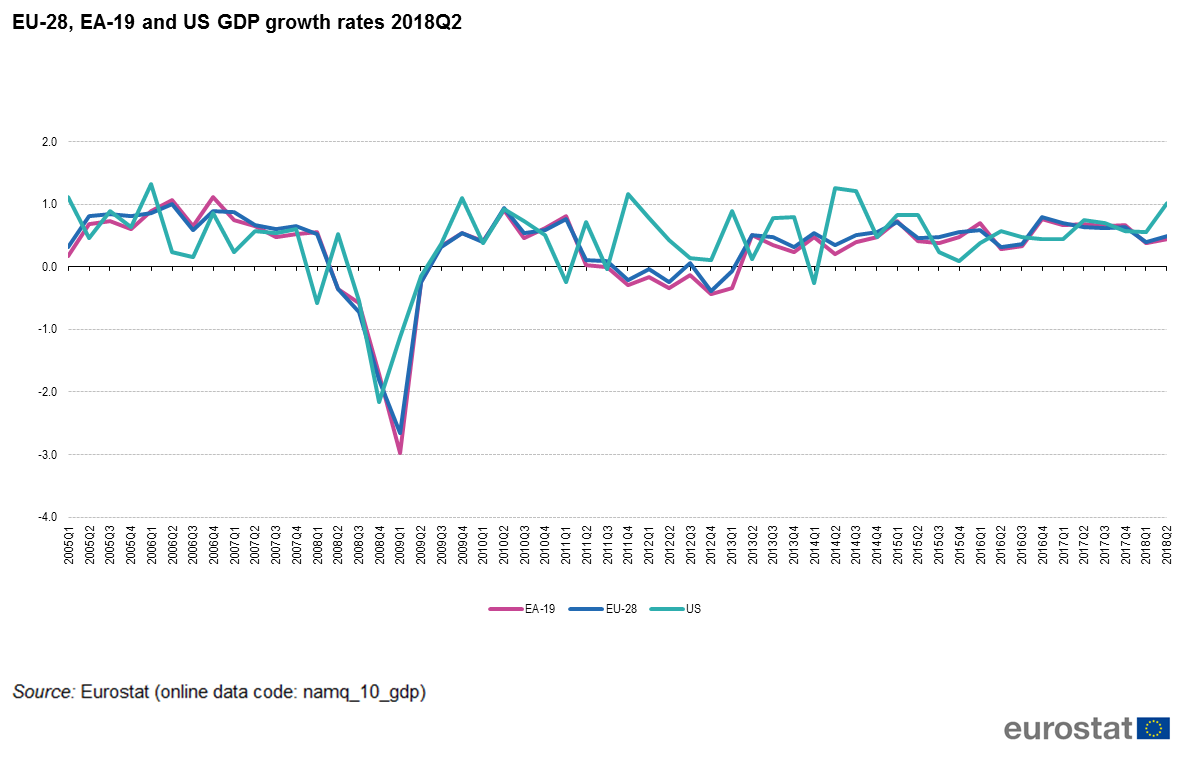
EU-28, EA-19 and US GDP growth rates 2018Q2.png
(
file
)
78 KB
2
14:58, 11 October 2018
GDP estimate 2018Q2.xlsx
(
file
)
24 KB
1
14:56, 11 October 2018
4 GDP estimate 2018Q2 final.xlsx
(
file
)
24 KB
1
14:55, 11 October 2018
Growth rates of GDP in volume (based on seasonally adjusted data) 2018Q2.png
(
file
)
443 KB
1
14:54, 11 October 2018
EU-28, EA-19 and Member States GDP growth rates 2018Q2.png
(
file
)
74 KB
1
16:20, 19 July 2018
4 GDP estimate 2018Q1.xls
(
file
)
83 KB
1
16:18, 19 July 2018
4 GDP estimate 2017Q4.xls
(
file
)
83 KB
3
12:28, 29 June 2018
Figure7-Evolution of main income components-2017.png
(
file
)
10 KB
1
12:27, 29 June 2018
Figure6-Changes to operating surplus and mixed income-2017.png
(
file
)
6 KB
1
12:26, 29 June 2018
Figure5-Changes to taxes on production and imports-2017.png
(
file
)
5 KB
1
12:24, 29 June 2018
Figure4-Changes to employers social contributions-2017.png
(
file
)
5 KB
1
12:23, 29 June 2018
Figure3-Changes to wages and salaries-2017.png
(
file
)
6 KB
1
12:22, 29 June 2018
Figure2-Changes to compensation of employees-2017.png
(
file
)
5 KB
1
12:21, 29 June 2018
Figure1-Shares of income components in GDP-2017.png
(
file
)
16 KB
2
12:20, 29 June 2018
Table1-Income components in GDP-2017.png
(
file
)
36 KB
3
14:26, 27 June 2018
Figure7-Impact of economic and financial crisis-2017.png
(
file
)
9 KB
2
12:05, 27 June 2018
Figure3-Change of operating surplus and mixes income-2017.png
(
file
)
6 KB
2
12:02, 21 June 2018
Figure6-Change of taxes on production and imports.png
(
file
)
6 KB
1
12:00, 21 June 2018
Figure5-Change of employers social contributions-2017.png
(
file
)
5 KB
1
11:56, 21 June 2018
Figure4-Change of wages and salaries-2017.png
(
file
)
5 KB
1
11:51, 21 June 2018
Figure2-Change of compensation of employees-2017.png
(
file
)
5 KB
1
12:19, 12 April 2018
3 Growth rates of GDP in volume (based on seasonally adjusted data) 2017Q4.png
(
file
)
29 KB
1
12:13, 12 April 2018
2 EU28,EA19 and MS GDP growth rates 2017Q4.png
(
file
)
5 KB
1
First page
Previous page
Next page
Last page
Special page
ISSN 2443-8219


.png)

_in_2018_and_1998.png)

_2018Q4.png)


_index_2005%3D100_of_household_expenditure_by_consumption_purpose_-_COICOP.png)
_index_2005%3D100_of_household_expenditure_by_consumption_purpose_-_COICOP.png)


_2018Q2.png)


_2017Q4.png)
