Tutorials
Log in
Statistics Explained
menu
search
search
Navigation
Main page
Statistical themes
Glossary
Categories
Statistics 4 beginners
Tutorials
Help
Eurostat home
Education corner
Online publications
Regional yearbook
Sustainable development
Full list
Tools
User contributions
Logs
View user groups
Special pages
search
Navigation
Main page
Statistical themes
Glossary
Categories
Statistics 4 beginners
Tutorials
Help
Eurostat home
Education corner
Online publications
Regional yearbook
Sustainable development
Full list
Tools
User contributions
Logs
View user groups
Special pages
Navigation
Main page
Statistical themes
Glossary
Categories
Statistics 4 beginners
Tutorials
Help
Eurostat home
Education corner
Online publications
Regional yearbook
Sustainable development
Full list
Tools
User contributions
Logs
View user groups
Special pages
Uploads by Konijpa
This special page shows all uploaded files.
File list
Items per page:
20
50
100
250
500
Search for media name:
Username:
Include old versions of files
Go
Date
Name
Thumbnail
Size
Description
Versions
11:05, 10 December 2014
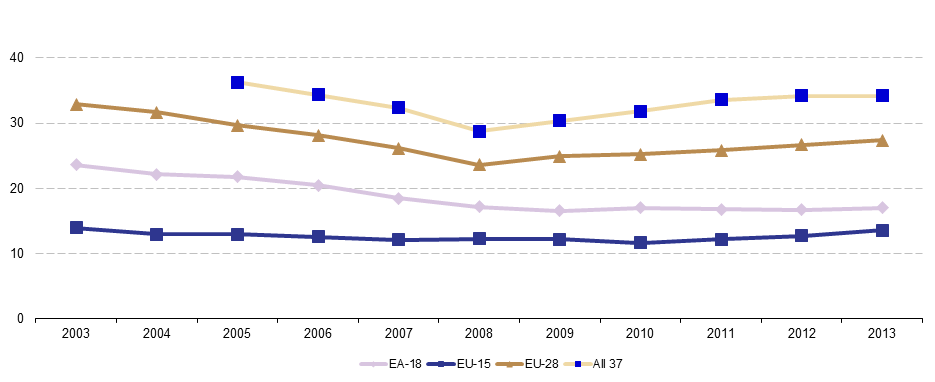
Price convergence variation coefficient of price level of household final consumption expenditure 2003 2013 ver1.png
(
file
)
21 KB
1
10:59, 10 December 2014
Price level index for household final consumption expenditure (HFCE), 2013, EU-28=100 - ver1.png
(
file
)
37 KB
1
10:54, 10 December 2014
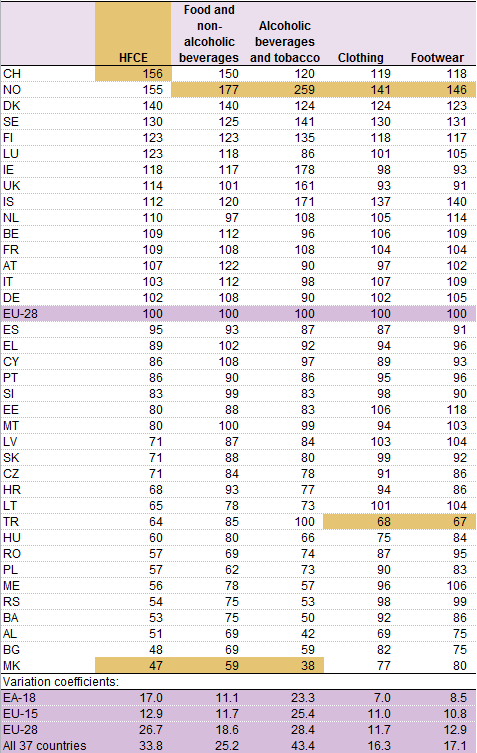
Price level index for 4 groups of goods and services, 2013, EU-28=100 - 3ver1.png
(
file
)
36 KB
1
10:54, 10 December 2014
Price level index for 4 groups of goods and services, 2013, EU-28=100 - 2ver1.png
(
file
)
36 KB
1
10:54, 10 December 2014
Price level index for 4 groups of goods and services, 2013, EU-28=100 - 1ver1.png
(
file
)
35 KB
1
16:39, 5 December 2014
Table. 1. Price level index for 4 groups of goods and services, 2013, EU28=100 June 2013.png
(
file
)
18 KB
Reverted to version as of 13:31, 16 June 2014
2
16:35, 5 December 2014
Volume indices per capita, 2010-2013(EU-28=100) V2.png
(
file
)
40 KB
Reverted to version as of 07:29, 18 June 2014
2
10:33, 23 April 2014
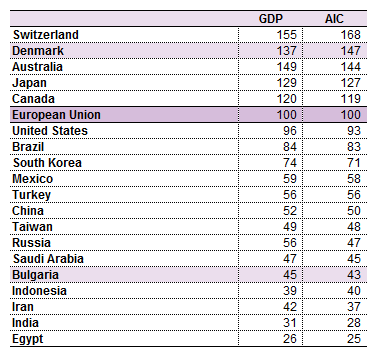
Price level indices for GDP and AIC, 2011, EU28=100.png
(
file
)
14 KB
3
10:33, 23 April 2014
GDP and AIC in PPS per capita, EU28=100.png
(
file
)
15 KB
5
10:04, 22 April 2014
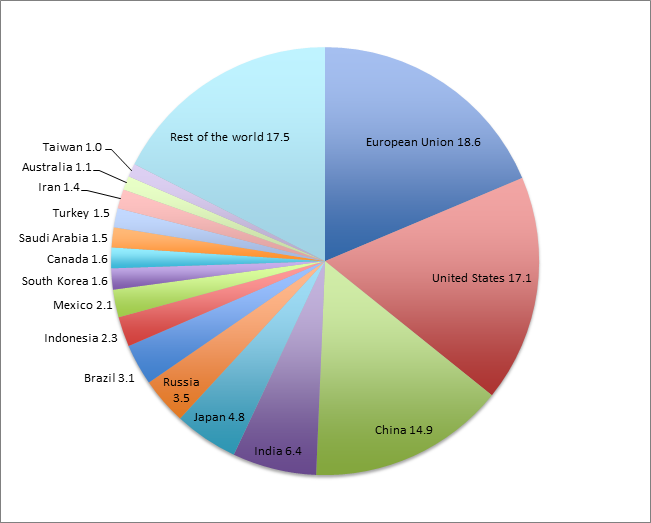
Figure 1 Shares in world GDP, 2011.jpg
(
file
)
50 KB
3
16:46, 5 May 2009
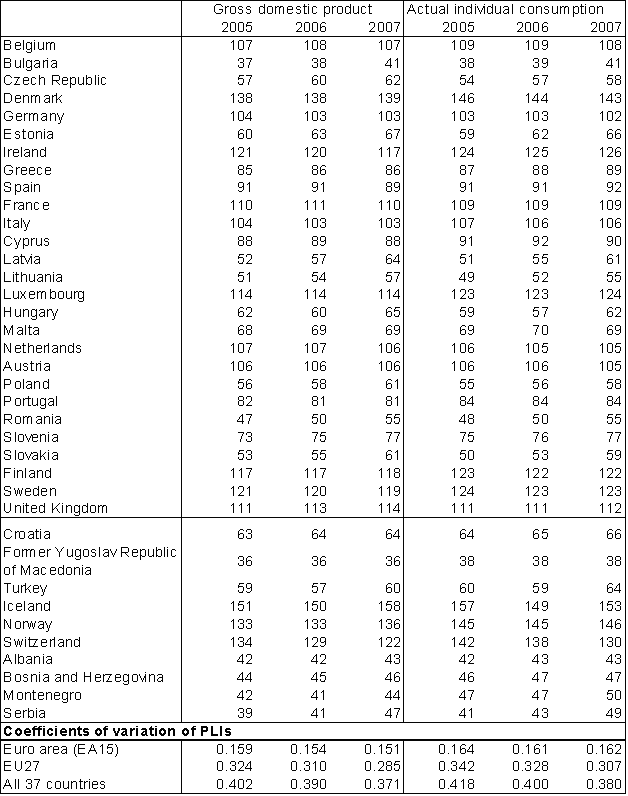
Table 2 Comparative price level indices 2005-2007, EU27=100.PNG
(
file
)
35 KB
1
Special page
ISSN 2443-8219

,_2013,_EU-28%3D100_-_ver1.png)


_V2.png)


