Tutorials
Log in
Statistics Explained
menu
search
search
Navigation
Main page
Statistical themes
Glossary
Categories
Statistics 4 beginners
Tutorials
Help
Eurostat home
Education corner
Online publications
Regional yearbook
Sustainable development
Full list
Tools
User contributions
Logs
View user groups
Special pages
search
Navigation
Main page
Statistical themes
Glossary
Categories
Statistics 4 beginners
Tutorials
Help
Eurostat home
Education corner
Online publications
Regional yearbook
Sustainable development
Full list
Tools
User contributions
Logs
View user groups
Special pages
Navigation
Main page
Statistical themes
Glossary
Categories
Statistics 4 beginners
Tutorials
Help
Eurostat home
Education corner
Online publications
Regional yearbook
Sustainable development
Full list
Tools
User contributions
Logs
View user groups
Special pages
Uploads by Grundsi
This special page shows all uploaded files.
File list
Items per page:
20
50
100
250
500
Search for media name:
Username:
Include old versions of files
Go
Date
Name
Thumbnail
Size
Description
Versions
10:47, 3 December 2018
Year-on-year nominal growth rate of gross disposable income as measured in National Accounts and EU-SILC, 2014-2015, %.png
(
file
)
32 KB
1
10:46, 3 December 2018
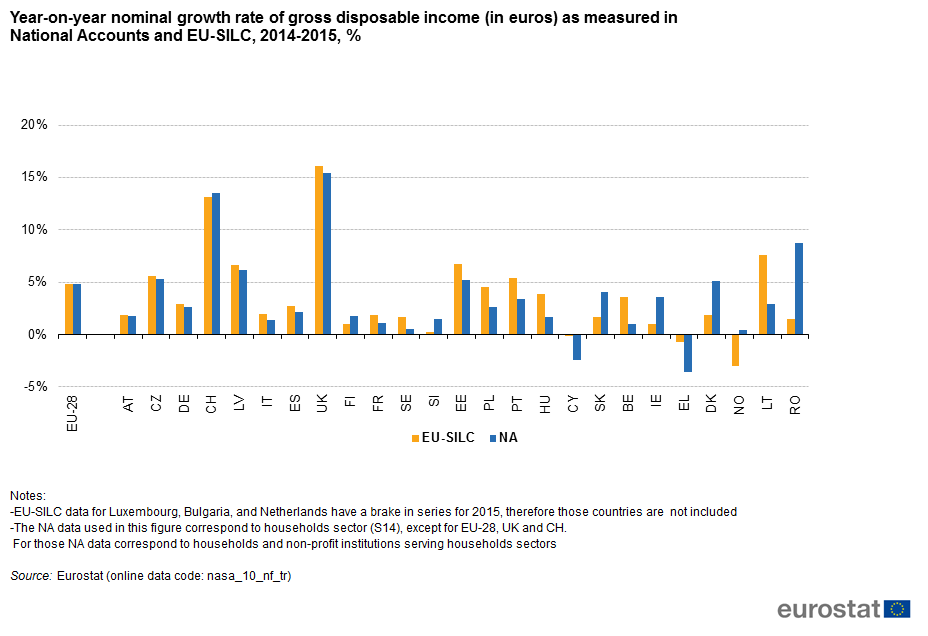
Year-on-year nominal growth rate of gross disposable income (in euros) as measured in National Accounts and EU-SILC, 2014-2015, %.png
(
file
)
32 KB
5
10:49, 27 November 2018
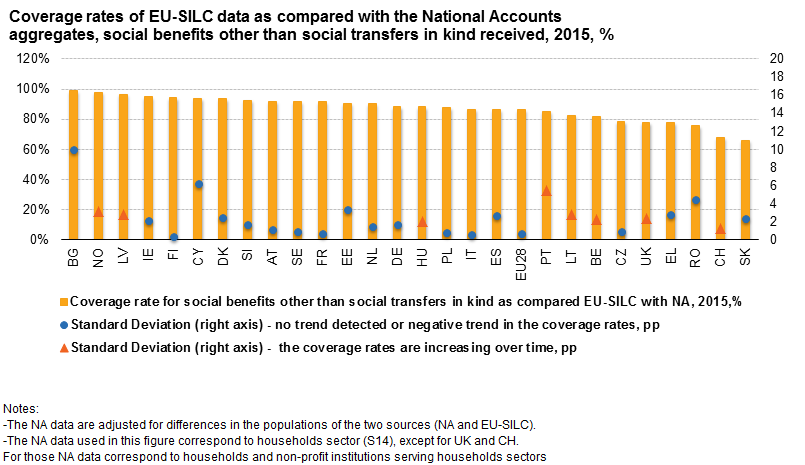
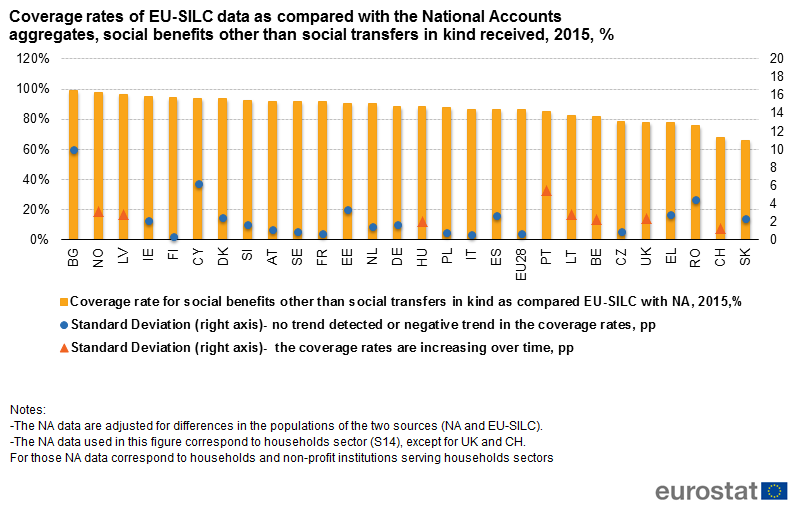
Coverage rates of EU-SILC data as compared with the National Accounts aggregates, social benefits other than social transfers in kind received, 2015, %.png
(
file
)
38 KB
1
10:40, 27 November 2018
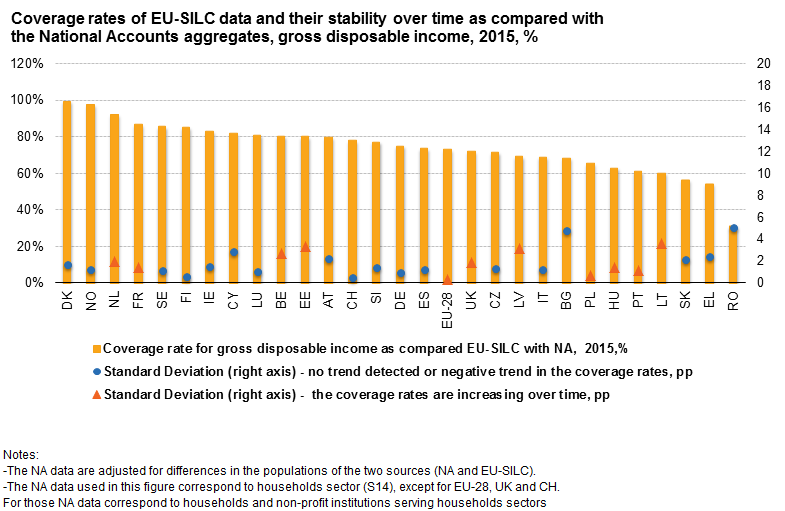
Coverage rates of EU-SILC data and their stability over time as compared with the National Accounts aggregates, gross disposable income, 2015, %.png
(
file
)
41 KB
2
17:49, 26 November 2018
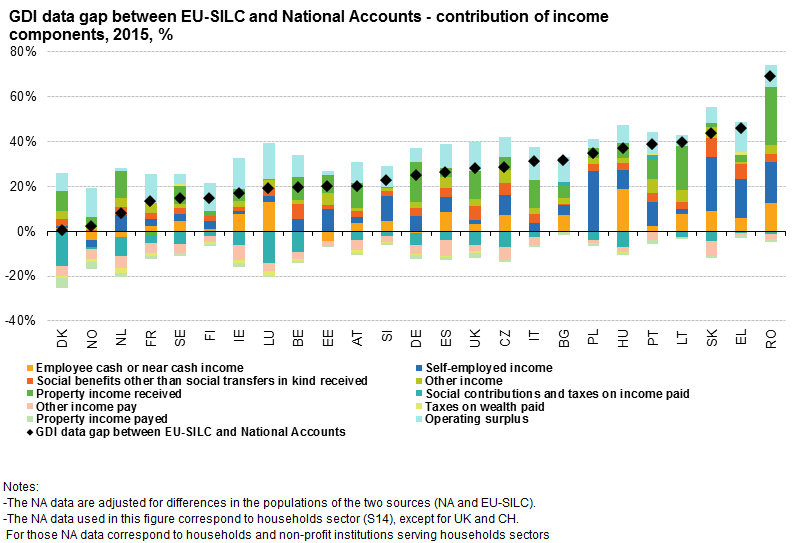
GDI data gap between EU-SILC and National Accounts - contribution of income components, 2015, %.png
(
file
)
37 KB
3
17:43, 26 November 2018
Year-on-year nominal growth rate of gross disposable income (in euros) as measured in National Accounts and EU-SILC for EU-28, 2008-2015, %.png
(
file
)
33 KB
1
17:19, 26 November 2018
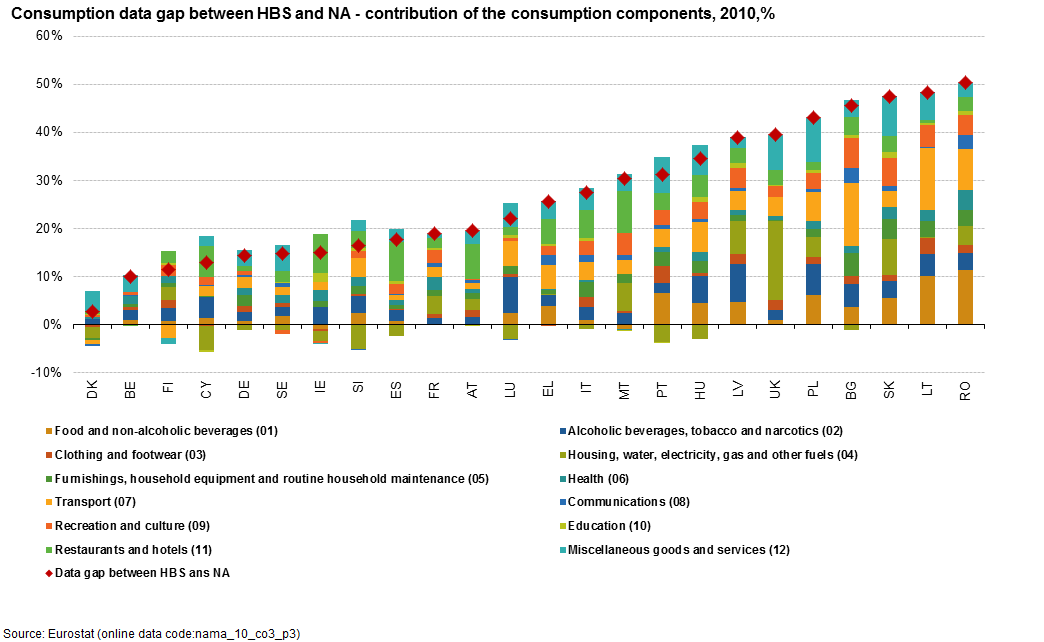
Consumption data gap between HBS and NA - contribution of the consumption components, 2010,%.png
(
file
)
42 KB
3
17:06, 26 November 2018
Population differences, domestic versus national concept of consumption, impact of FISIM, 2010, %.png
(
file
)
28 KB
2
16:37, 26 November 2018
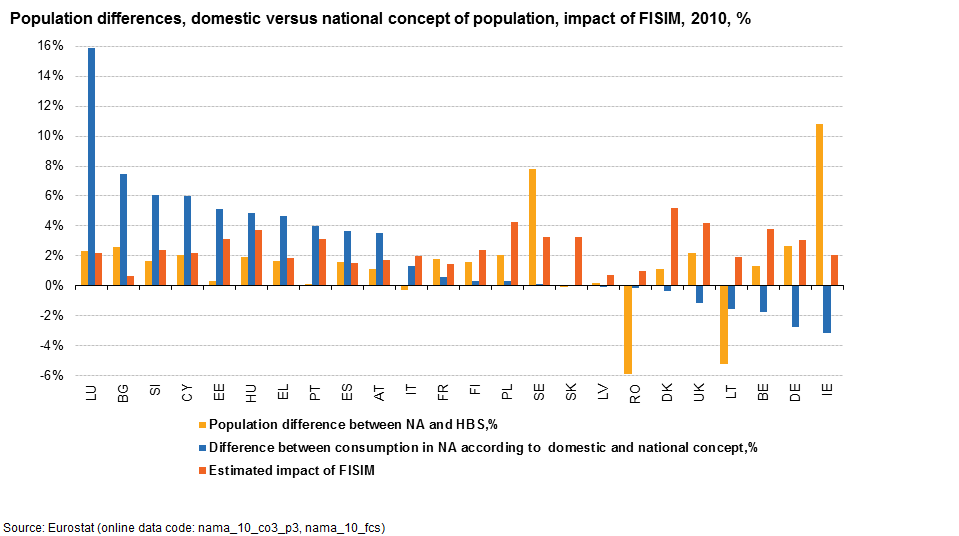
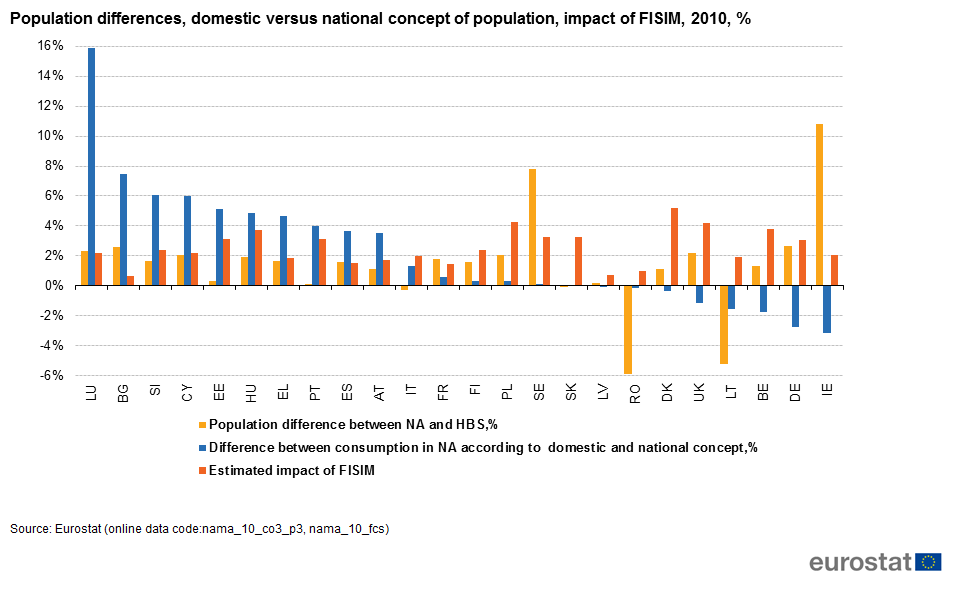
Population differences, domestic versus national concept of population, impact of FISIM, 2010, %.png
(
file
)
28 KB
4
16:29, 26 November 2018
Consumption data gap between HBS and NA - contribution of the consumtion components, 2010,%.png
(
file
)
43 KB
2
13:04, 26 October 2018
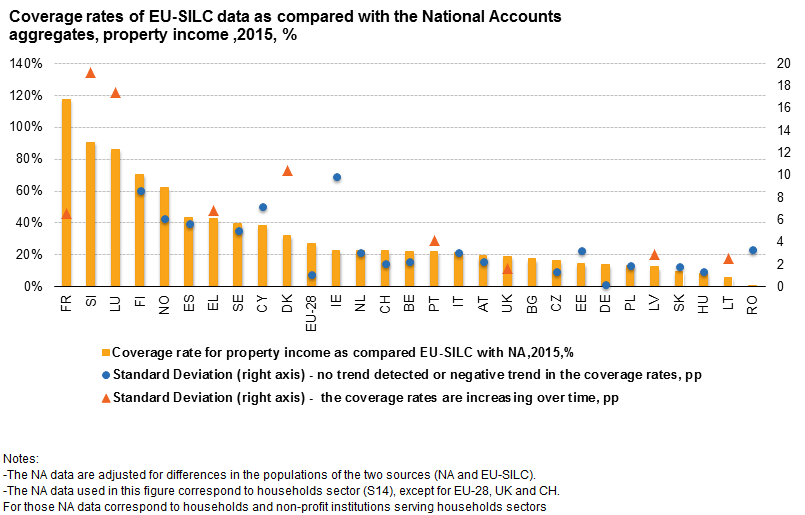
Coverage rates of EU-SILC data as compared with the National Accounts aggregates, property income ,2015, %.png
(
file
)
37 KB
2
12:53, 26 October 2018
Coverage rates of EU-SILC data as compared with National Accounts aggregates; disposable income components, 2015, %.png
(
file
)
47 KB
3
10:45, 18 October 2018
Year-on-year nominal growth rate of gross disposable income (in euros) as measured in National Accounts and EU-SILC for EU-28, 2014-2015, %.png
(
file
)
37 KB
2
10:45, 18 October 2018
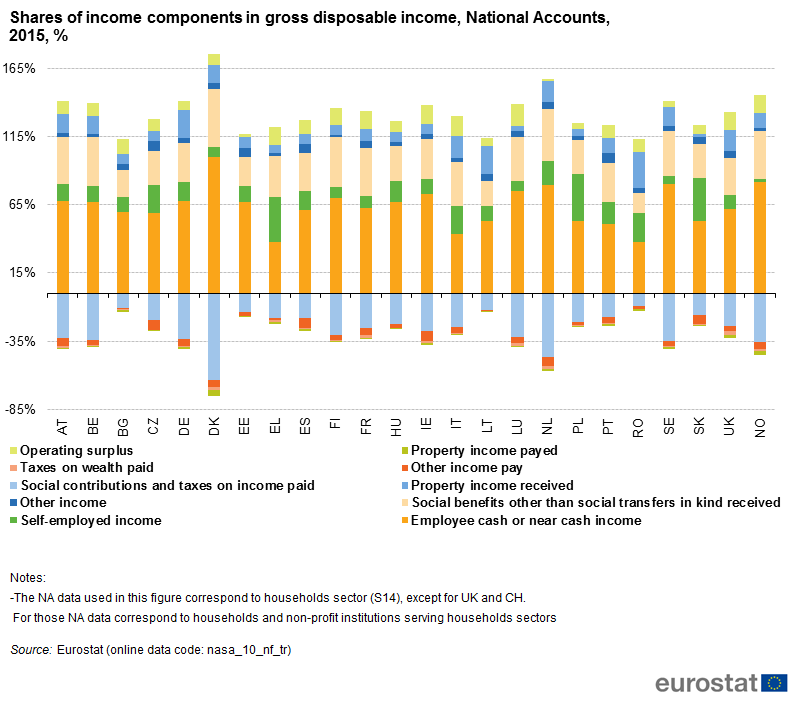
Shares of income components in gross disposable income, National Accounts, 2015, %.png
(
file
)
48 KB
1
10:44, 18 October 2018
Coverage rates of social contributions and taxes on income paid (excluding employer’s imputed social contributions), 2015, %.png
(
file
)
51 KB
1
10:43, 18 October 2018
Coverage rates of social benefits other than social transfers in kind received, 2015, %.png
(
file
)
42 KB
1
10:43, 18 October 2018
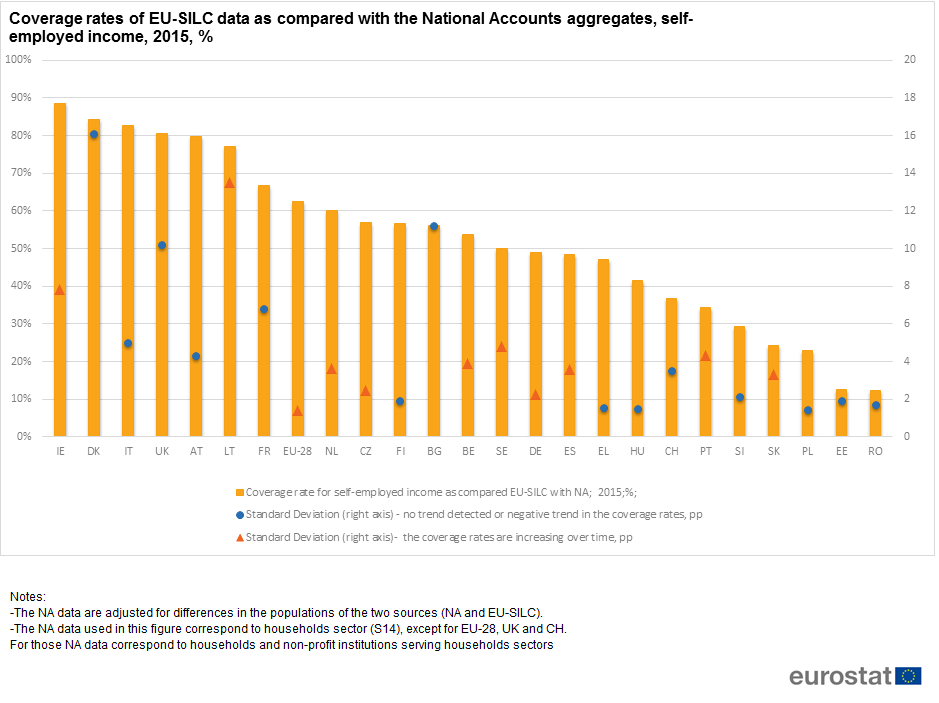
Coverage rates of EU-SILC data as compared with the National Accounts aggregates, self-employed income, 2015, %.png
(
file
)
50 KB
1
10:42, 18 October 2018
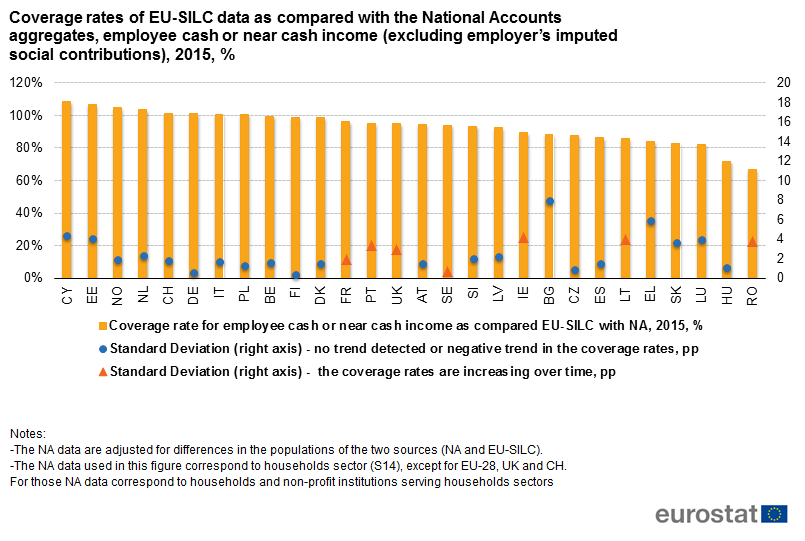
Coverage rates of employee cash or near cash income (excluding imputed social contributions of employer), 2015, %.png
(
file
)
46 KB
1
12:03, 16 October 2018
Share of consumption expenditure for housing, water, electricity, gas and other fuels (04) in total consumption in NA and HBS, 2010, %.png
(
file
)
47 KB
Reverted to version as of 09:39, 15 October 2018
3
11:57, 16 October 2018
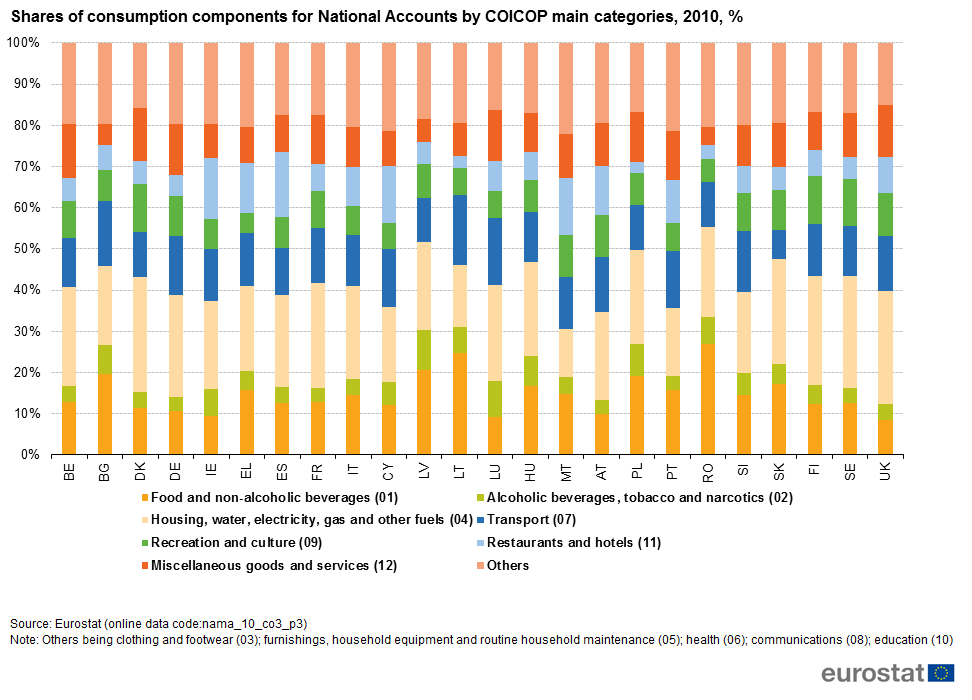
Shares of consumption components for National Accounts by COICOP main categories, 2010, %1.png
(
file
)
62 KB
1
11:57, 16 October 2018
Share of consumption expenditure for housing, water, electricity, gas and other fuels (04) in total consumption in NA and HBS, 2010, %1.png
(
file
)
47 KB
1
11:04, 16 October 2018
Population differences, domestic versus national concept of population, impact of FISIM, 2010,1 %.png
(
file
)
32 KB
1
11:04, 16 October 2018
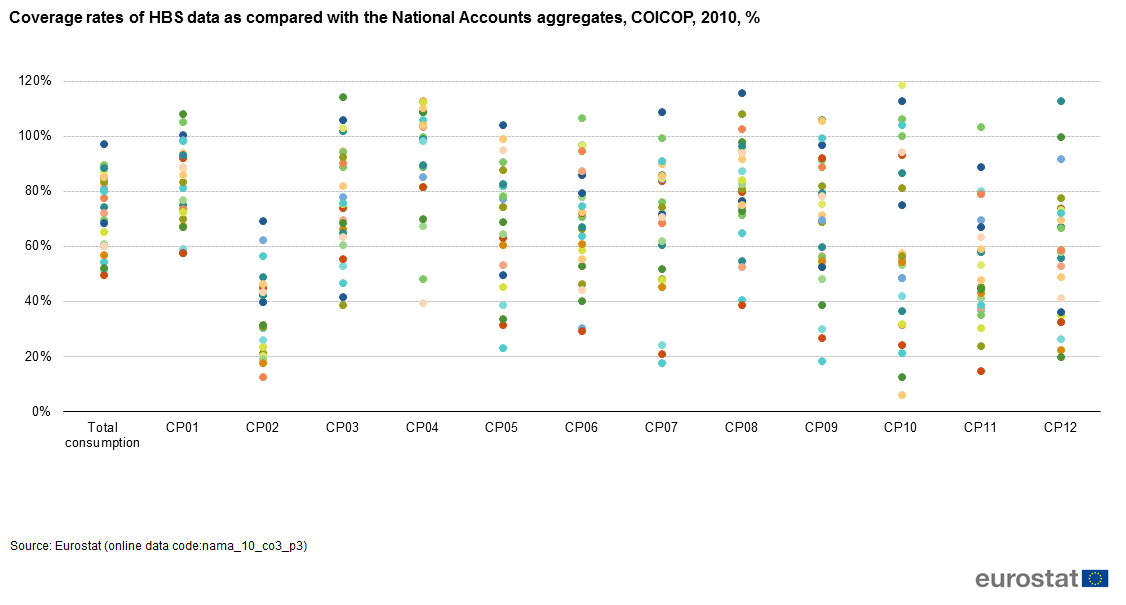
Coverage rates of HBS data as compared with the National Accounts aggregates, COICOP, 2010,1 %.png
(
file
)
45 KB
1
11:03, 16 October 2018
Consumption data gap between HBS and NA - contribution of the consumption components, 2010,%1.png
(
file
)
47 KB
1
10:57, 16 October 2018
Shares of consumption components for National Accounts by COICOP main categories, 2010, %.png
(
file
)
62 KB
2
10:55, 16 October 2018
Coverage rates of HBS data as compared with the National Accounts aggregates, COICOP, 2010, %.png
(
file
)
45 KB
2
11:38, 15 October 2018
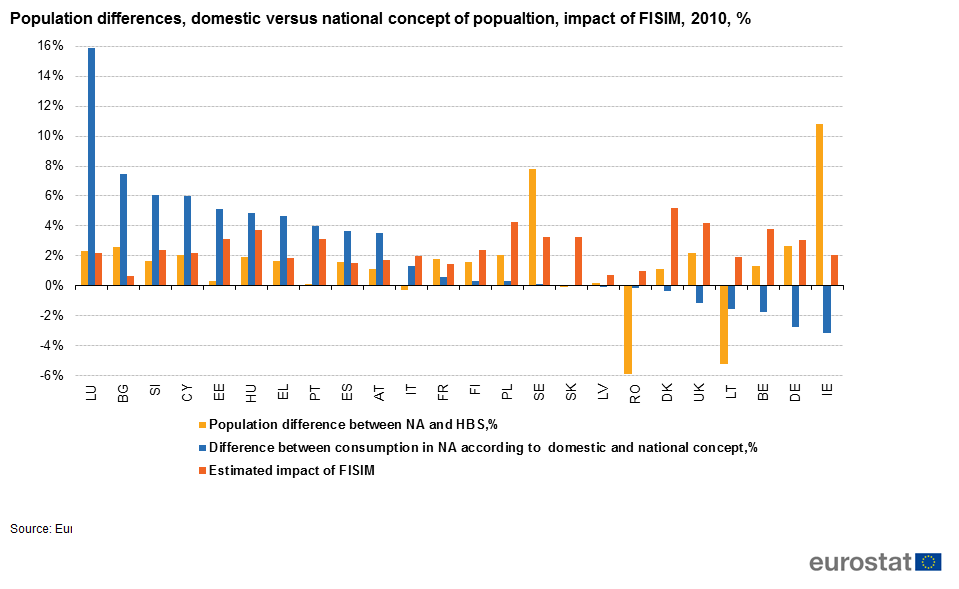
Population differences, domestic versus national concept of popualtion, impact of FISIM, 2010, %.png
(
file
)
31 KB
1
10:10, 15 October 2018
Shares of income components in gross disposable income, National Accounts, 2015, % (2).png
(
file
)
49 KB
1
11:40, 11 July 2018
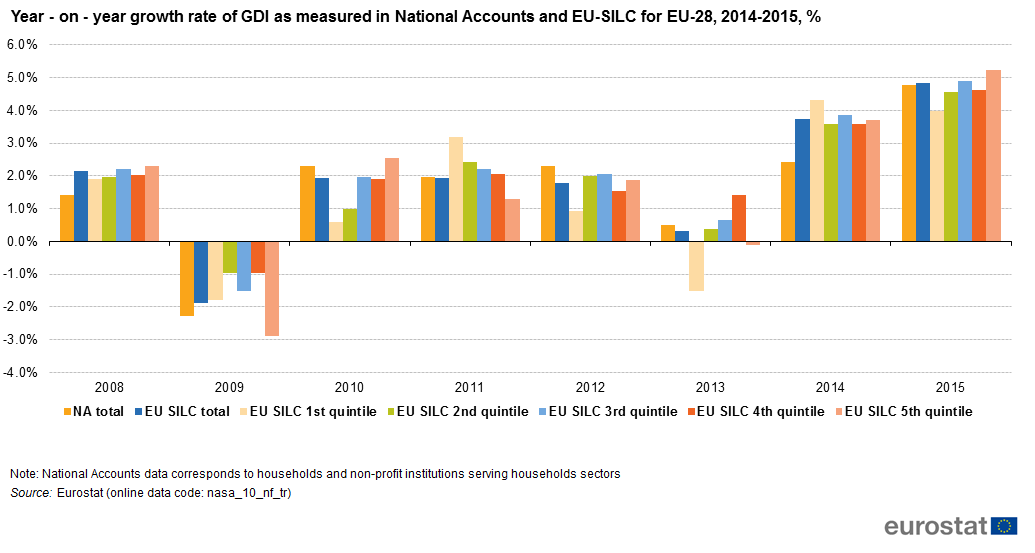
Year - on - year growth rate of GDI as measured in National Accounts and EU-SILC for EU-28, 2014-2015, %.png
(
file
)
36 KB
3
Special page
ISSN 2443-8219

_as_measured_in_National_Accounts_and_EU-SILC,_2014-2015,_%25.png)


_as_measured_in_National_Accounts_and_EU-SILC_for_EU-28,_2008-2015,_%25.png)


_as_measured_in_National_Accounts_and_EU-SILC_for_EU-28,_2014-2015,_%25.png)

,_2015,_%25.png)


,_2015,_%25.png)
_in_total_consumption_in_NA_and_HBS,_2010,_%25.png)

_in_total_consumption_in_NA_and_HBS,_2010,_%251.png)


.png)
