Tutorials
Log in
Statistics Explained
menu
search
search
Navigation
Main page
Statistical themes
Glossary
Categories
Statistics 4 beginners
Tutorials
Help
Eurostat home
Education corner
Online publications
Regional yearbook
Sustainable development
Full list
Tools
User contributions
Logs
View user groups
Special pages
search
Navigation
Main page
Statistical themes
Glossary
Categories
Statistics 4 beginners
Tutorials
Help
Eurostat home
Education corner
Online publications
Regional yearbook
Sustainable development
Full list
Tools
User contributions
Logs
View user groups
Special pages
Navigation
Main page
Statistical themes
Glossary
Categories
Statistics 4 beginners
Tutorials
Help
Eurostat home
Education corner
Online publications
Regional yearbook
Sustainable development
Full list
Tools
User contributions
Logs
View user groups
Special pages
Uploads by Antuome
This special page shows all uploaded files.
File list
Items per page:
20
50
100
250
500
Search for media name:
Username:
Include old versions of files
Go
First page
Previous page
Next page
Last page
Date
Name
Thumbnail
Size
Description
Versions
16:07, 17 September 2019
Figure 17 Persons in employment with care responsibilities by main obstacle at work for reconciliation, 2018.png
(
file
)
44 KB
2
15:53, 13 September 2019
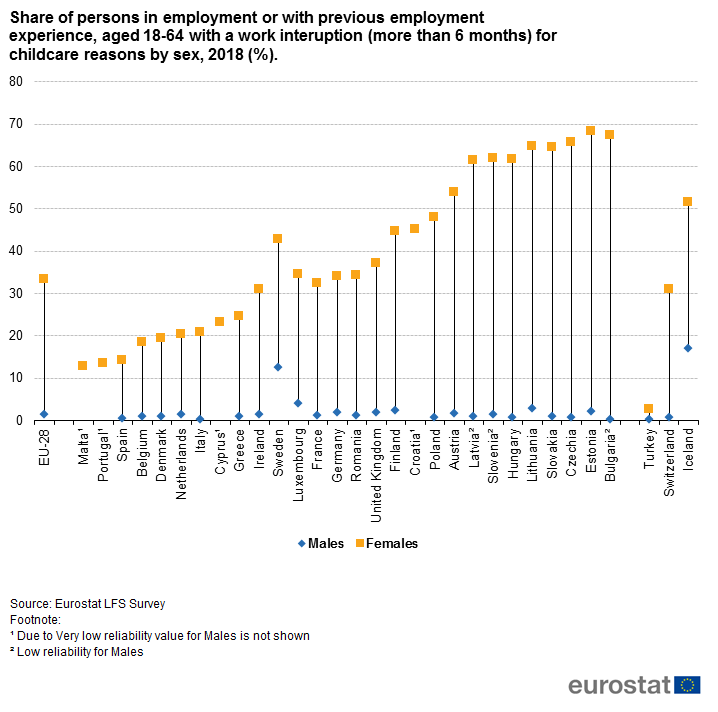
Figure 21 Share of persons in employment or with previous employment experience, aged 18-64 with a work interruption by sex.png
(
file
)
32 KB
1
15:48, 13 September 2019
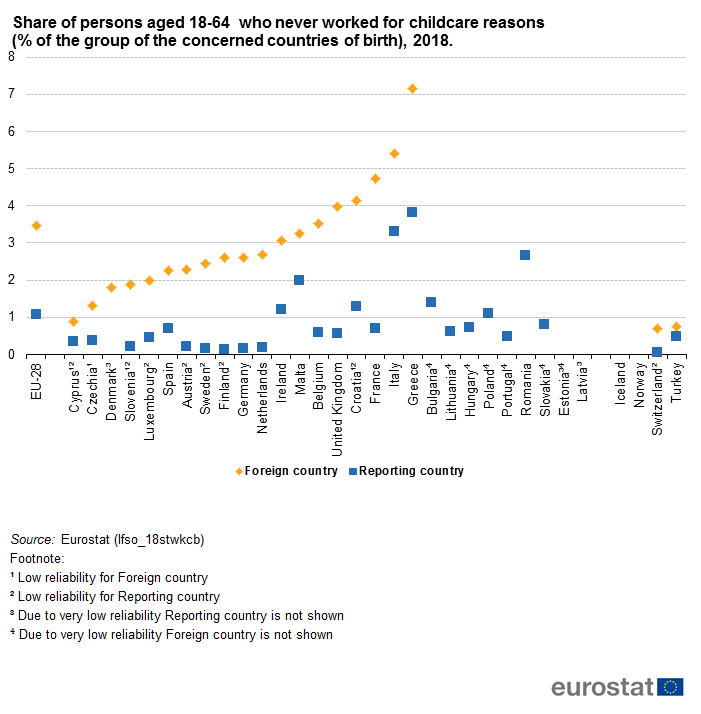
Figure 20 Share of persons aged 18-64 who never worked for childcare reasons.png
(
file
)
29 KB
1
15:43, 13 September 2019
Figure 19 Population in employment or with previous employment by effects of childcare on employment, 2018.png
(
file
)
51 KB
1
14:59, 13 September 2019
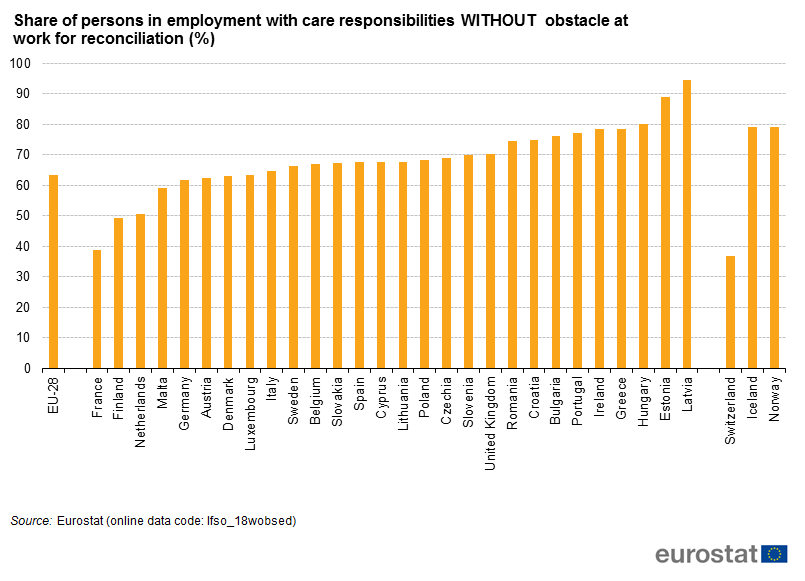
Figure 18 Share of persons in employment with care responsibilities WITHOUT obstacle at work for reconciliation.png
(
file
)
43 KB
1
14:06, 13 September 2019
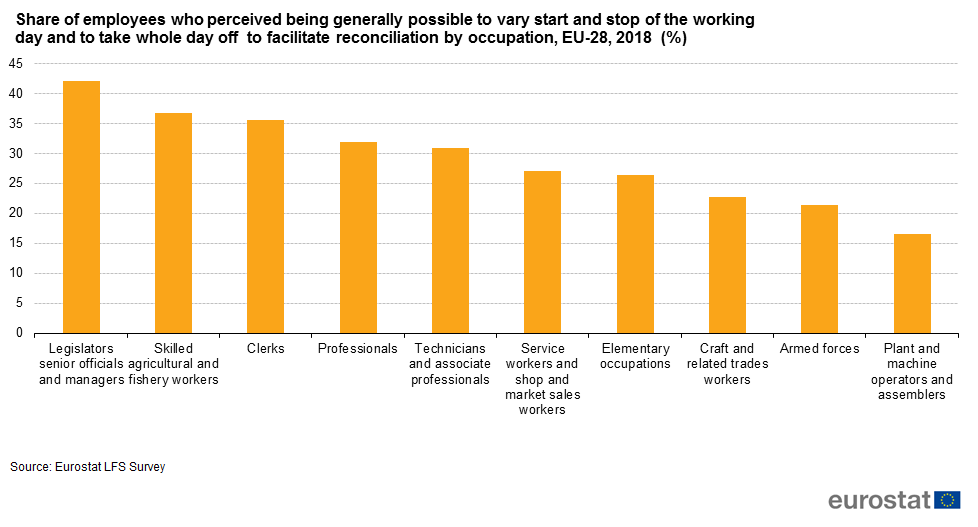
Figure 16 employees who perceived being generally possible to vary start and stop of the working day and to take whole day off to facilitate reconciliation.png
(
file
)
30 KB
1
14:05, 13 September 2019
Figure 15 Employees by their perceived possibility to use time flexibility and taking whole days off to facilitate care responsibilities.png
(
file
)
103 KB
1
11:43, 13 September 2019
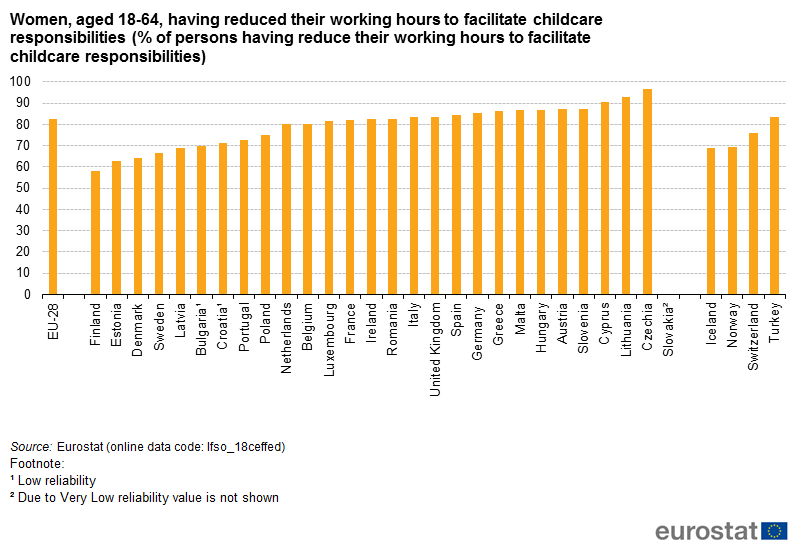
Figure 14 Women, aged 18-64, having reduced their working hours to facilitate childcare responsibilities.png
(
file
)
44 KB
1
11:42, 13 September 2019
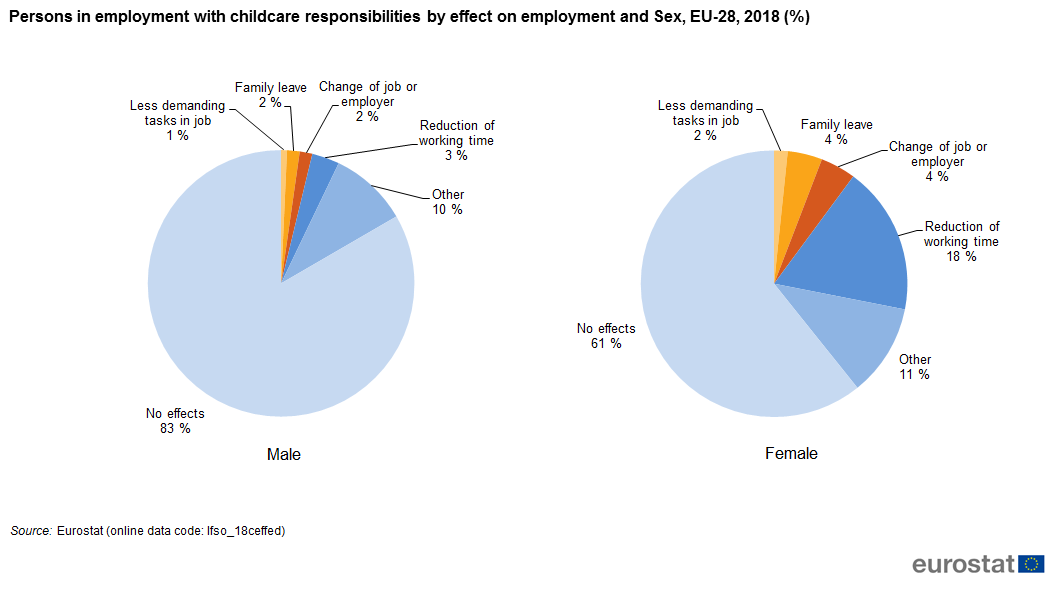
Figure 13 Persons in employment with childcare responsibilities by effect on employment and Sex, EU-28, 2018 (%).png
(
file
)
45 KB
2
11:39, 13 September 2019
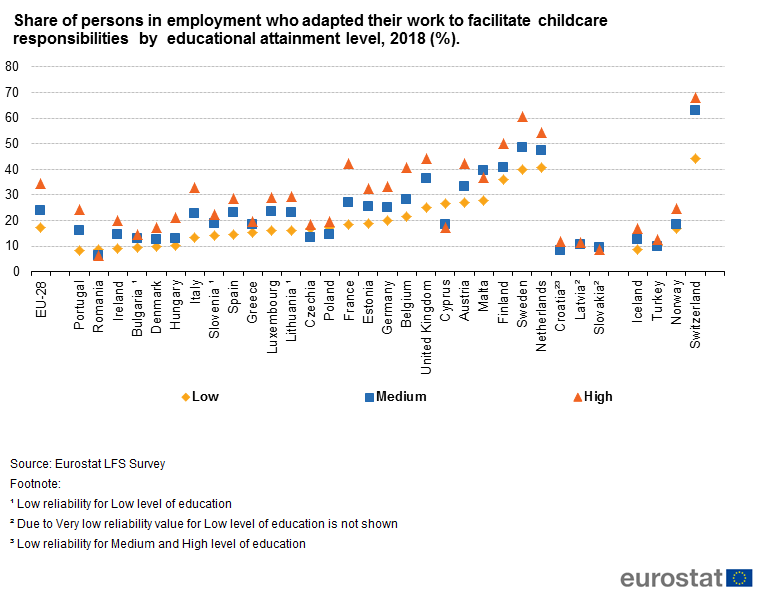
Figure 12 Share of persons in employment who adapted their work to facilitate childcare responsibilities by educational attainment level.png
(
file
)
31 KB
1
14:46, 6 June 2019
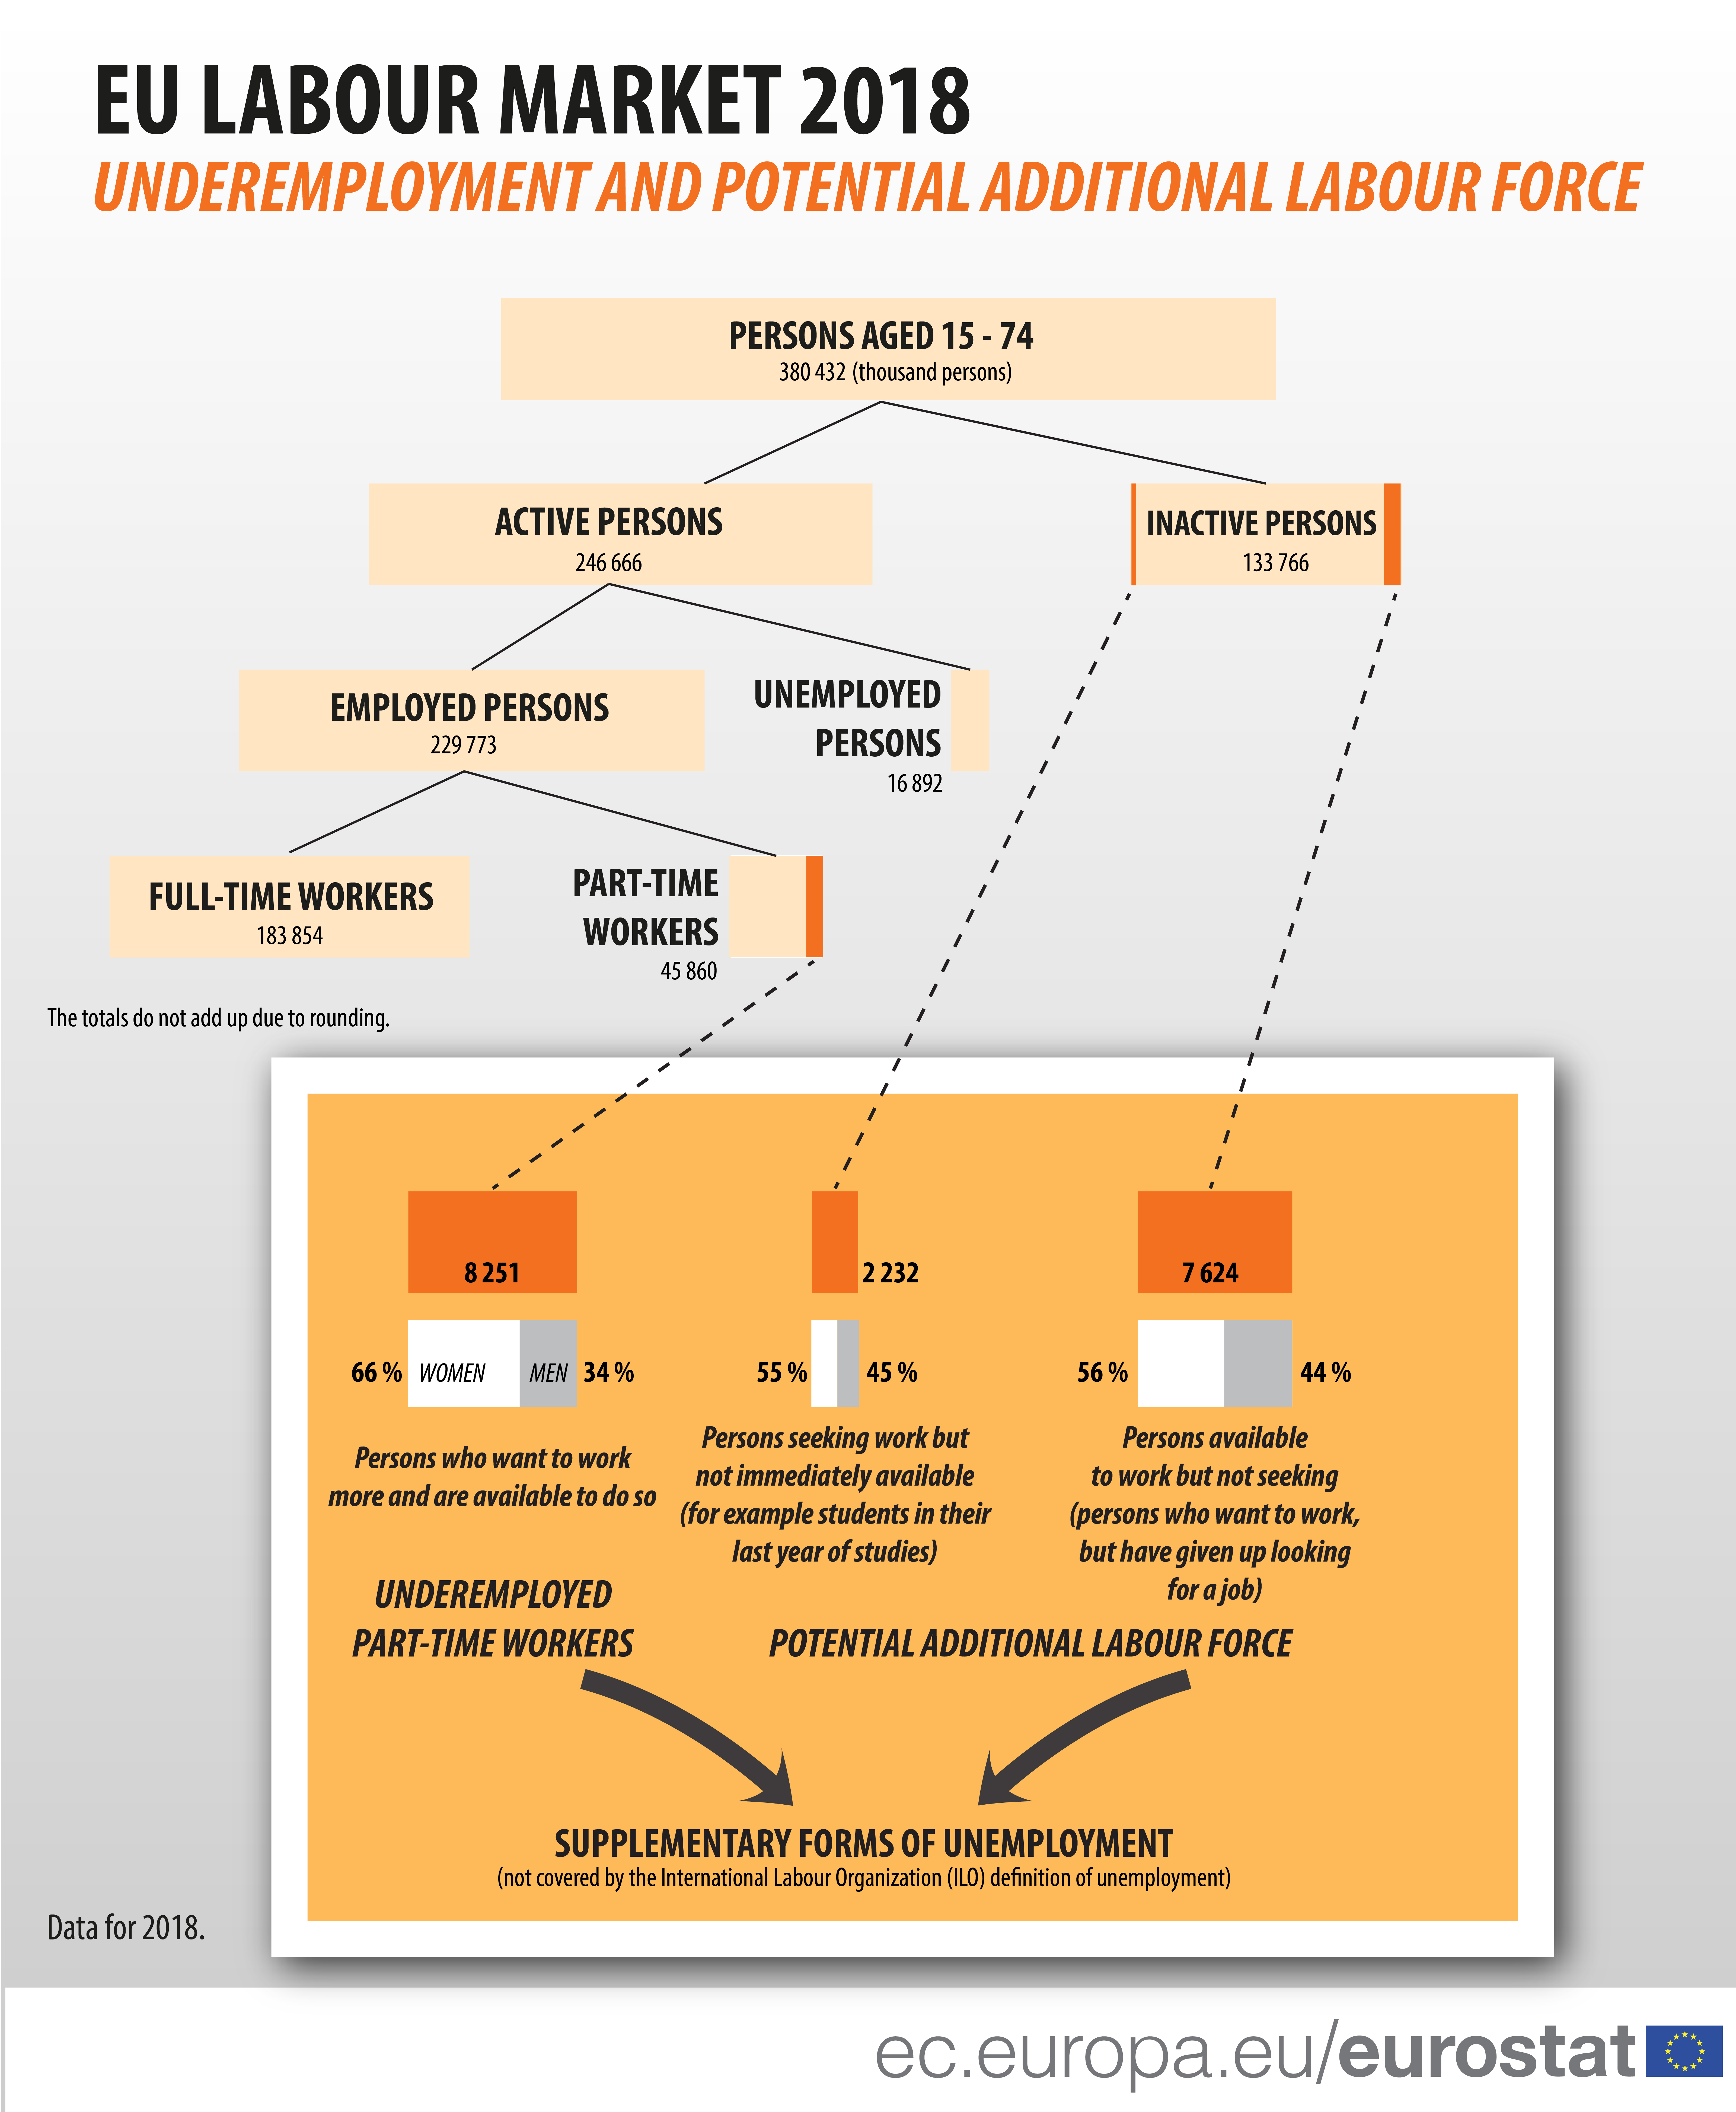
Supplementary indicators to unemployment, definition and characteristics of the population Persons aged 15-74, EU-28, annual average, 2018 (thousand persons).jpg
(
file
)
Error creating thumbnail: File with dimensions greater than 30 MP
4.51 MB
1
13:36, 27 May 2019
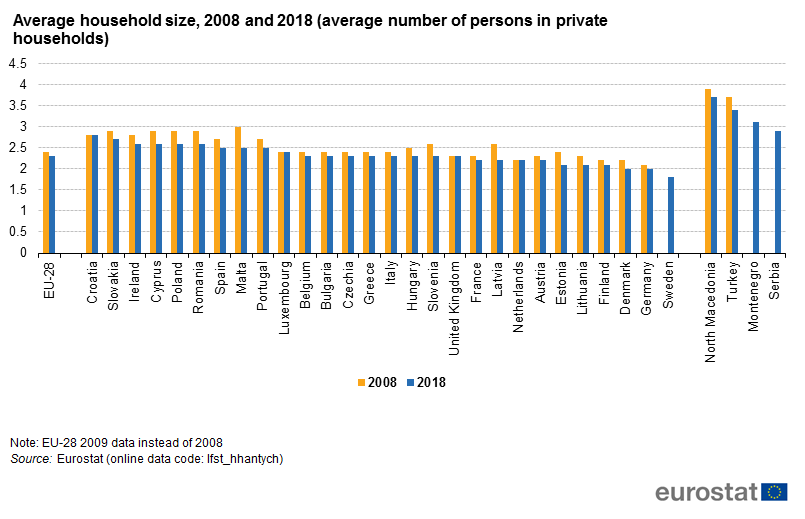
Average household size, 2008 and 2018 (average number of persons in private households) new.png
(
file
)
39 KB
3
15:40, 24 May 2019
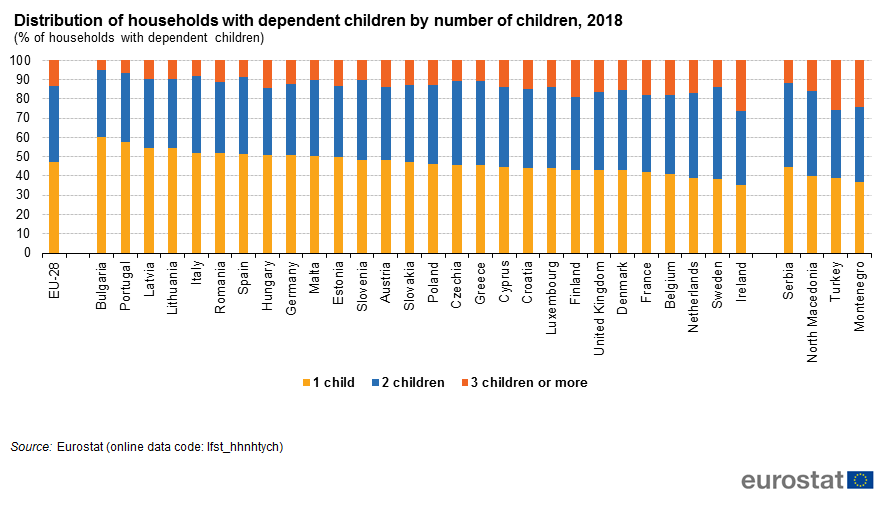
Distribution of households with dependent children by number of children 2018 % of households with dependent children.png
(
file
)
43 KB
2
09:08, 24 May 2019
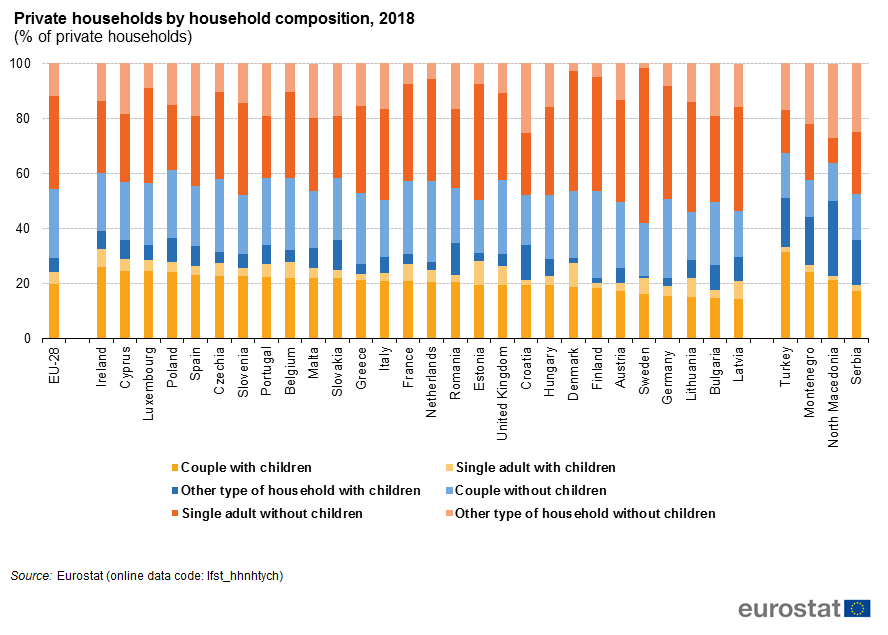
Private households by household composition, 2018 (% of private households) final.png
(
file
)
52 KB
1
09:06, 24 May 2019
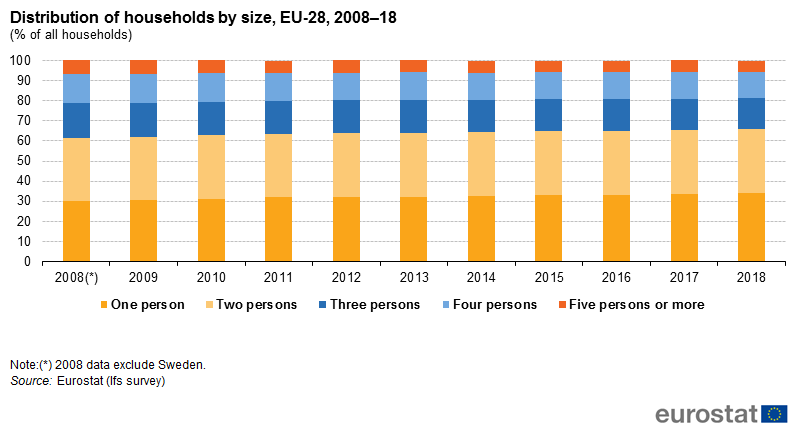
Distribution of households by size, EU-28, 2008–18 (% of all households) new.png
(
file
)
25 KB
1
17:08, 21 May 2019
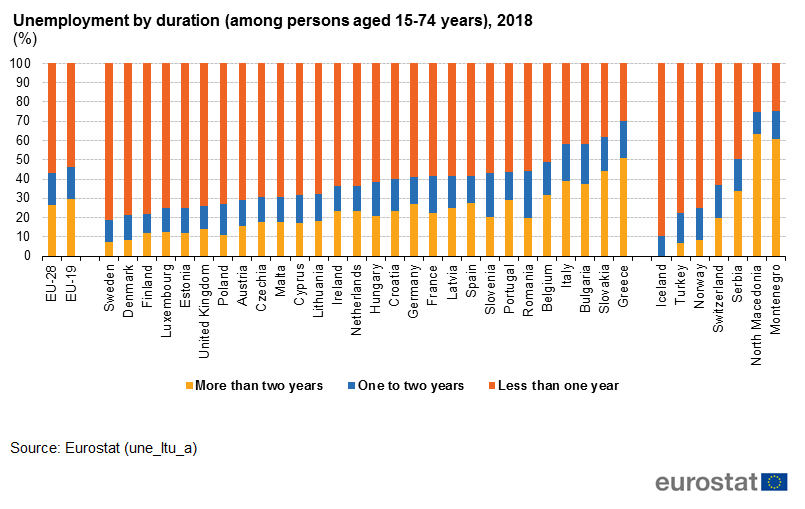
Unemployment rate by duration, 2018 (%).png
(
file
)
45 KB
1
17:07, 21 May 2019
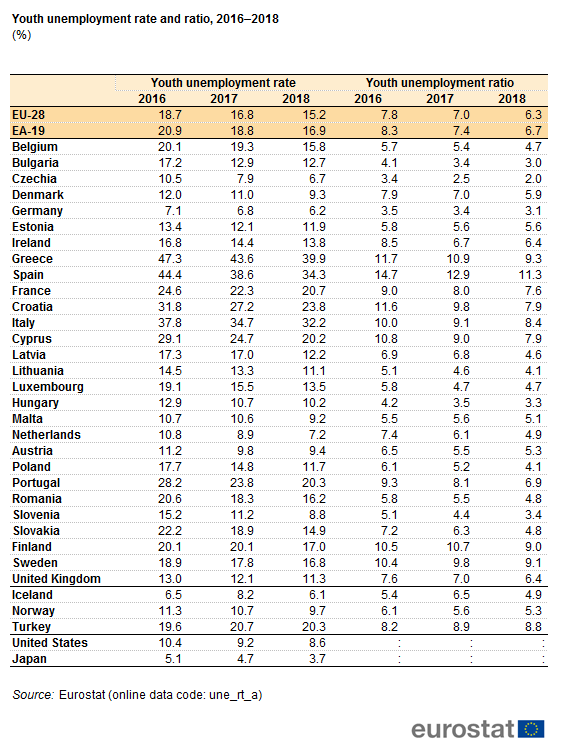
Youth unemployment rate and ratio, 2016-2018 (%).png
(
file
)
39 KB
1
14:11, 6 May 2019
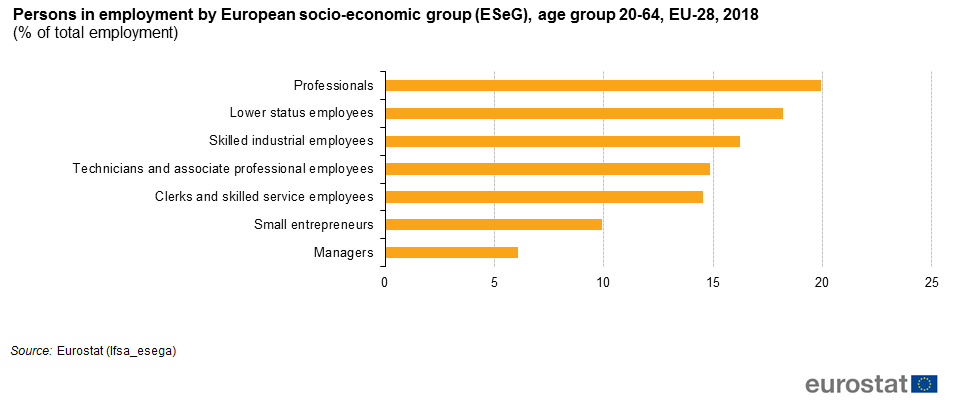
Persons in employment by European socio-economic group (ESeG), age group 20-64, EU-28, 2018.png
(
file
)
20 KB
scale up to 25
2
14:10, 6 May 2019
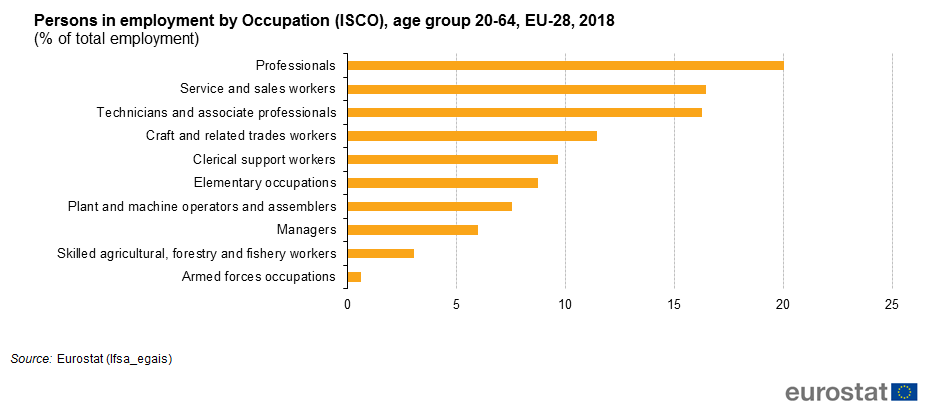
Persons in employment by Occupation (ISCO), age group 20-64, EU-28, 2018.png
(
file
)
23 KB
new scale
2
14:09, 6 May 2019
Persons in employment by Occupation (ISCO), age group 20-64, EU-28, 2017 .png
(
file
)
23 KB
new scale up to 25
2
11:08, 3 May 2019
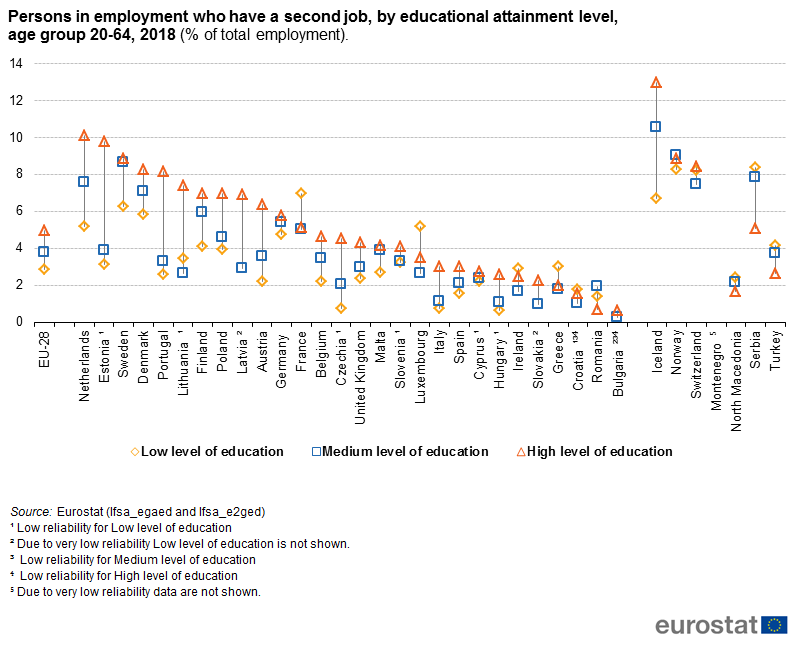
Persons in employment who have a second job, by educational attainment level, age group 20-64, 2018 (% of total employment).png
(
file
)
38 KB
footnote added
2
10:53, 3 May 2019
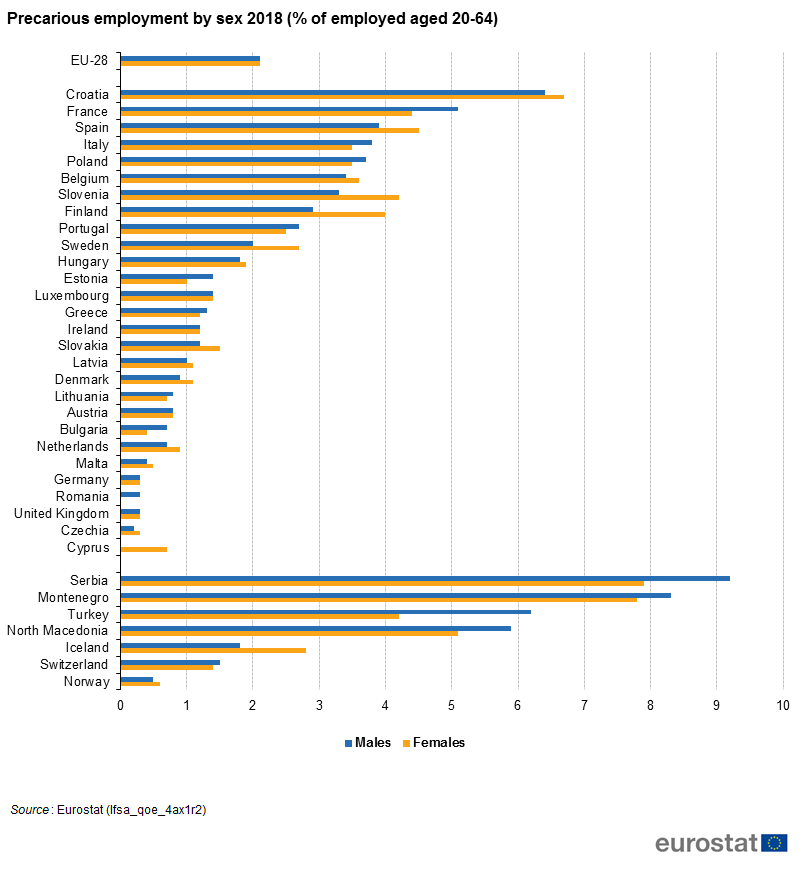
Precarious employment by sex 2018 (% of employed aged 20-64).png
(
file
)
39 KB
1
10:52, 3 May 2019
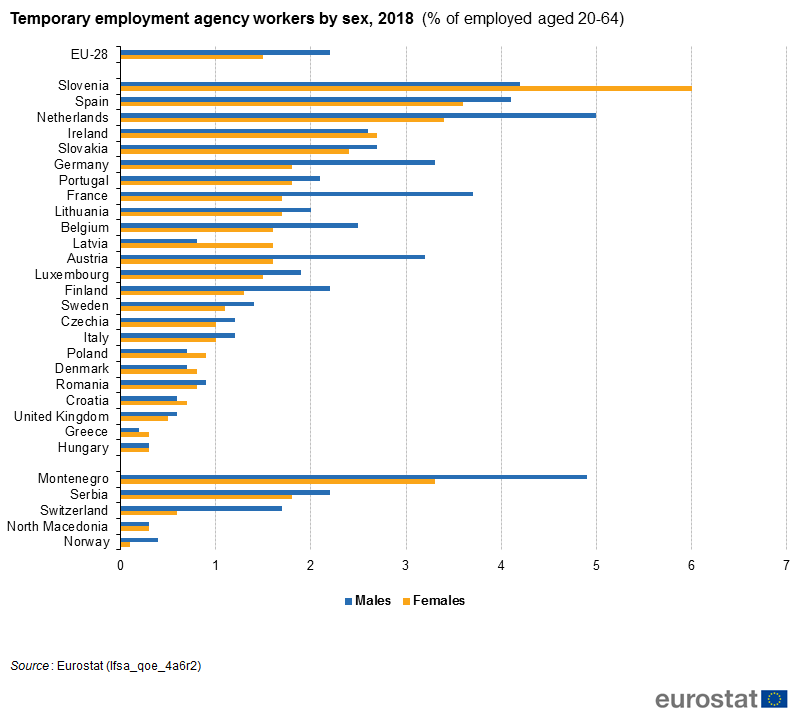
Temporary employment agency workers by sex, 2018 (% of employed aged 20-64).png
(
file
)
33 KB
1
18:39, 22 January 2019
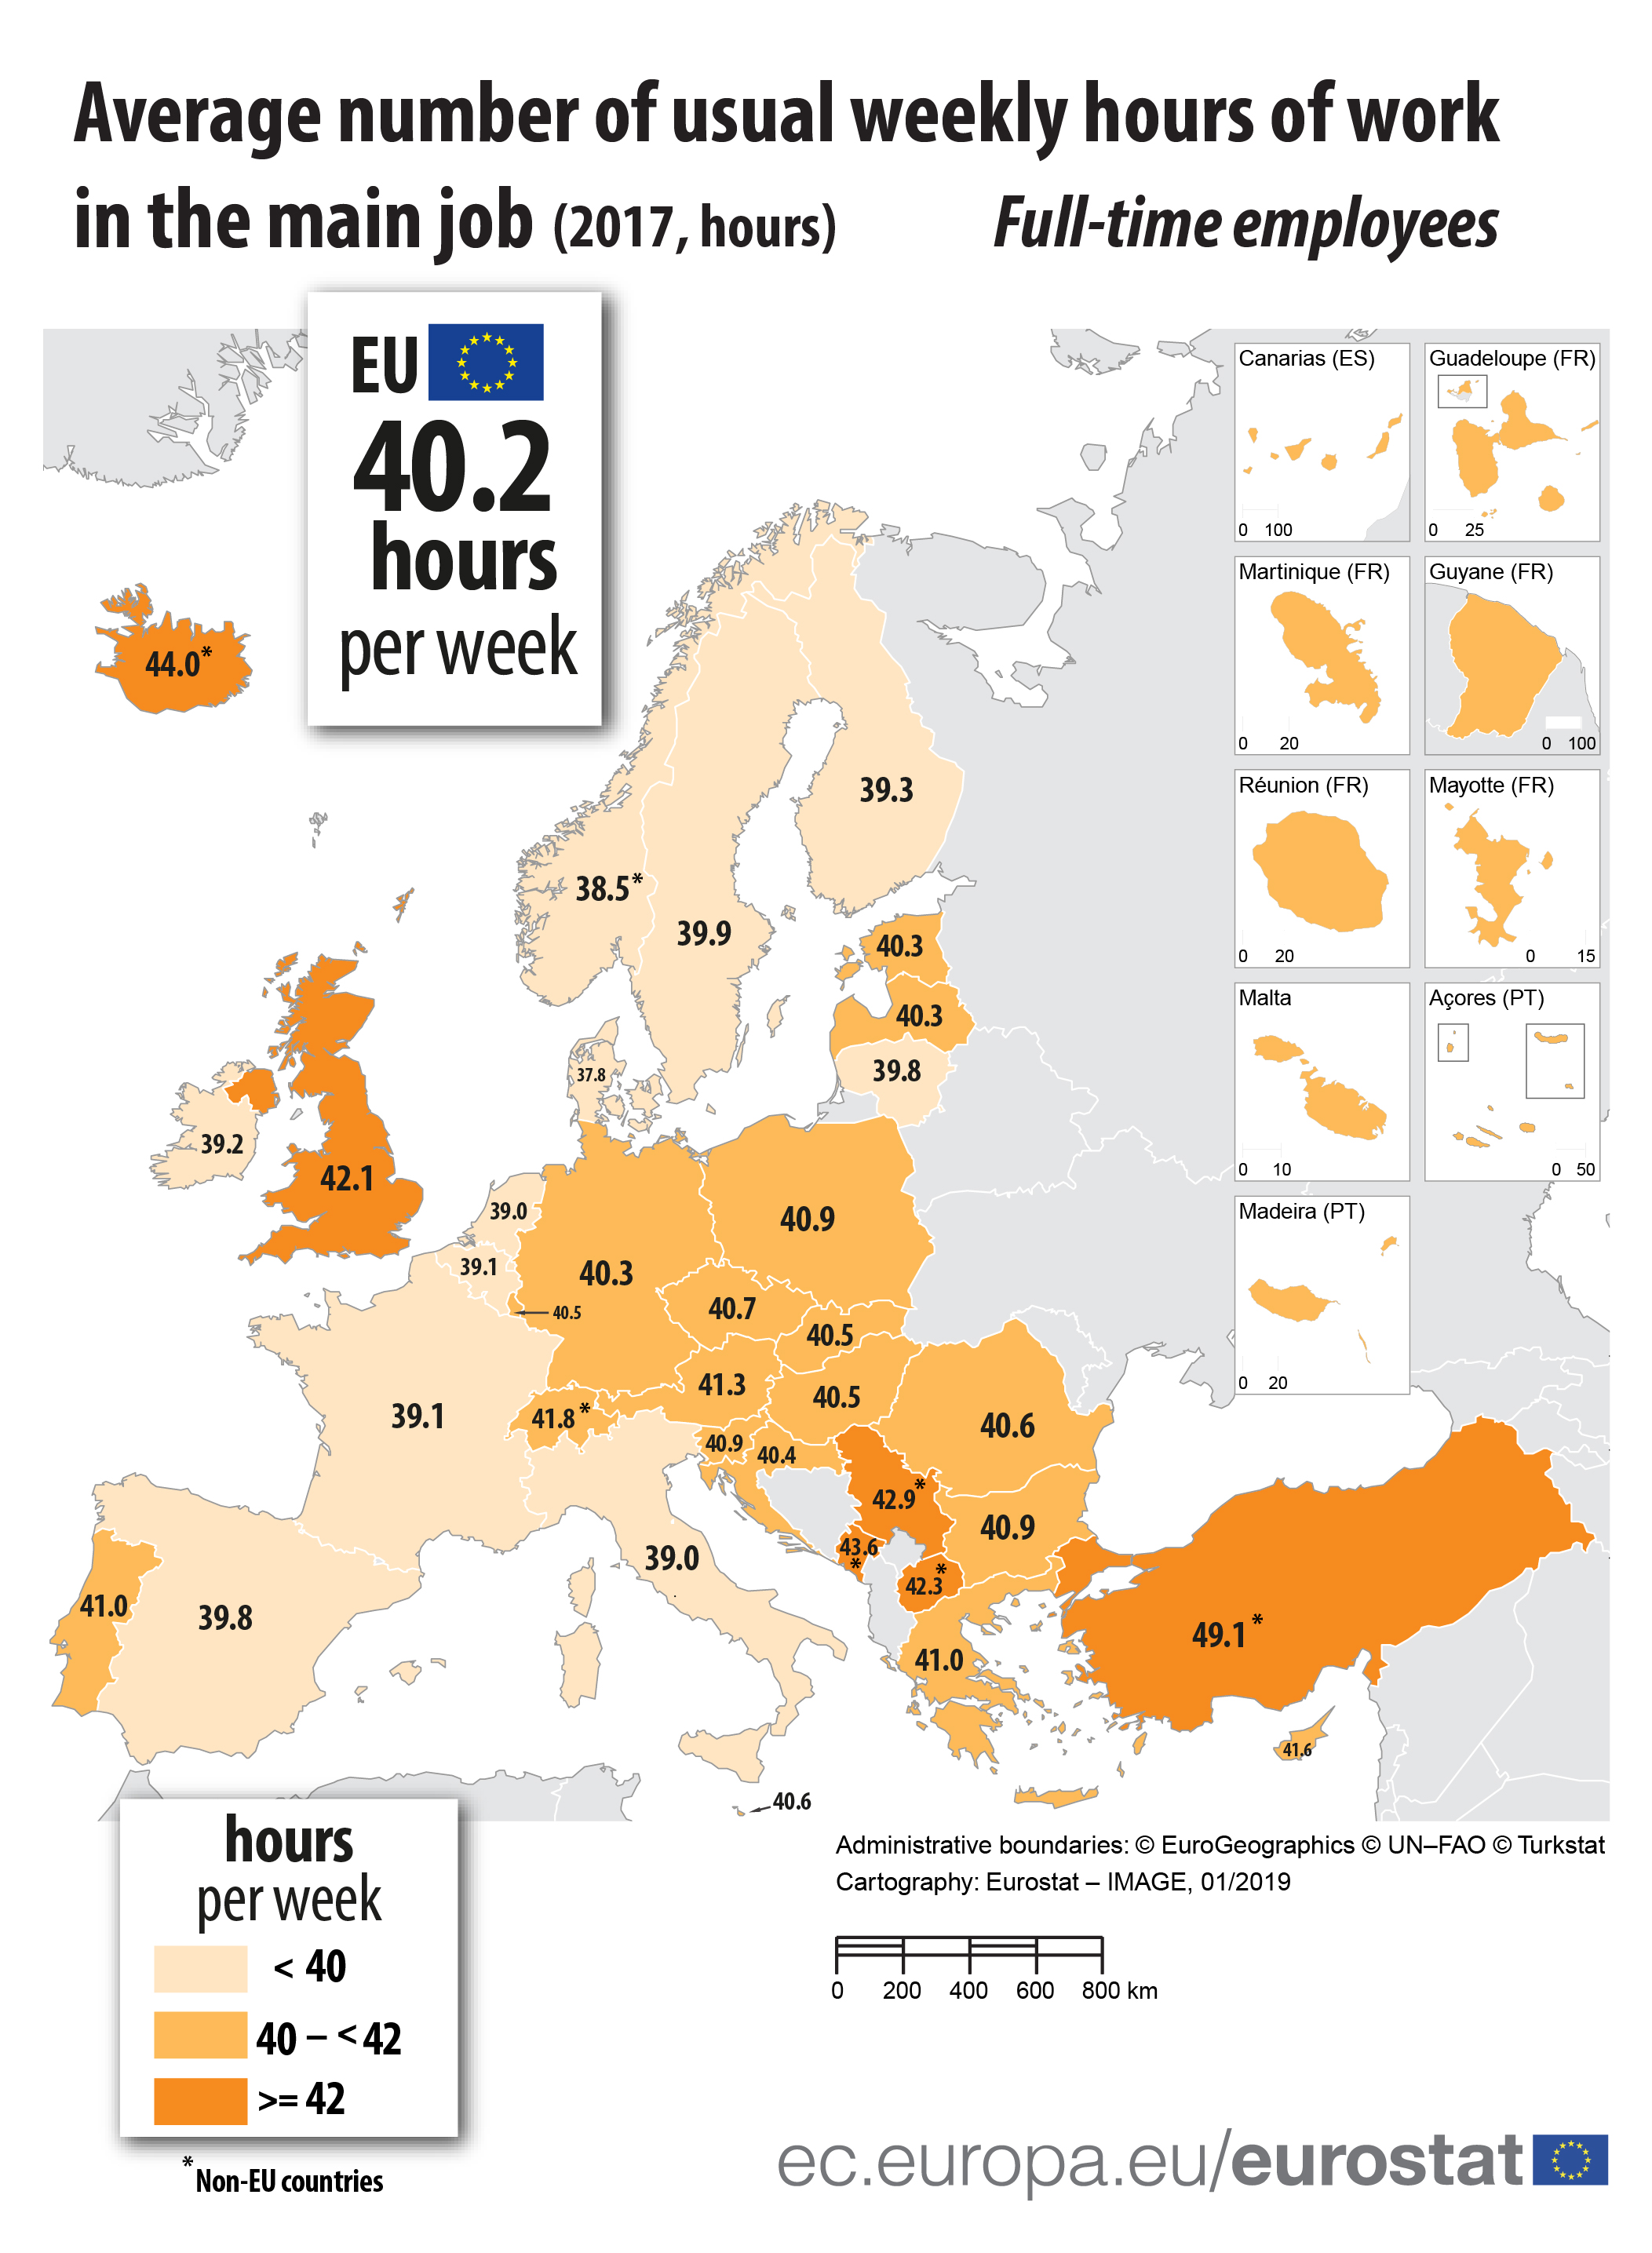
Average number of usual weekly hours of work in the main job - full time employees (2017, hours).jpg
(
file
)
1.35 MB
1
14:16, 22 January 2019
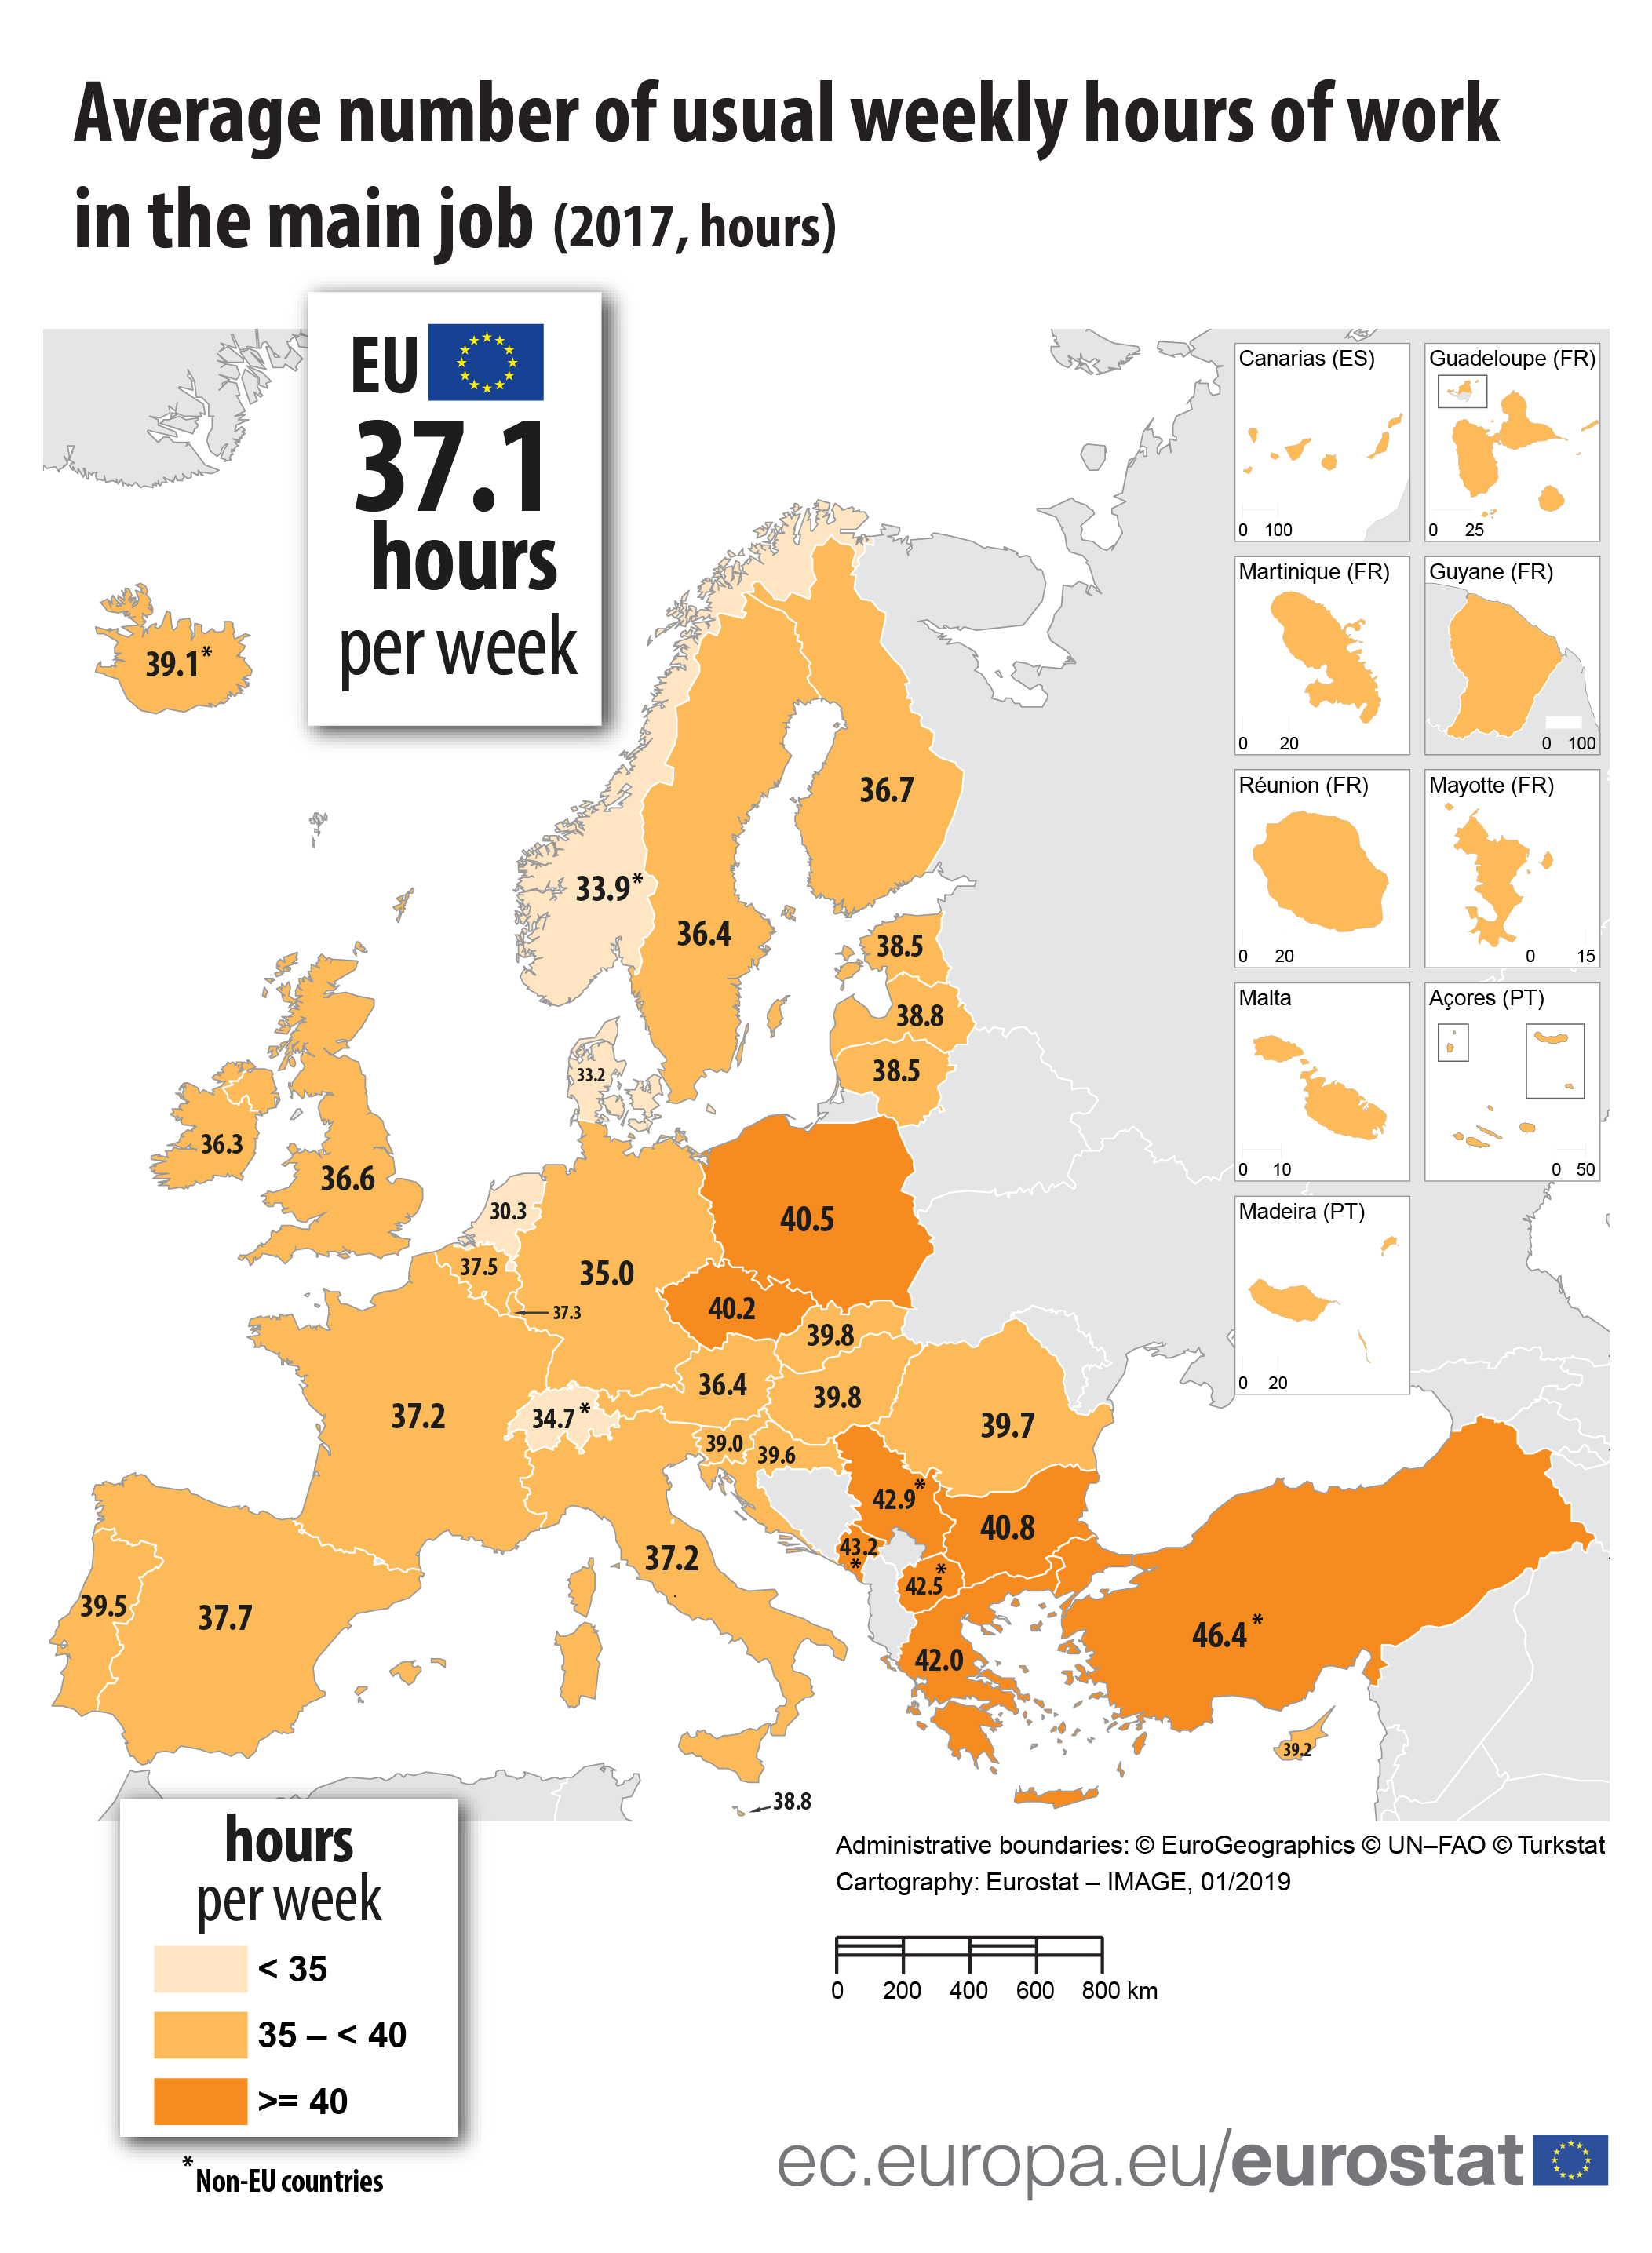
Average number of usual weekly hours of work in the main job (2017, hours) .jpg
(
file
)
1.36 MB
1
12:43, 5 December 2018
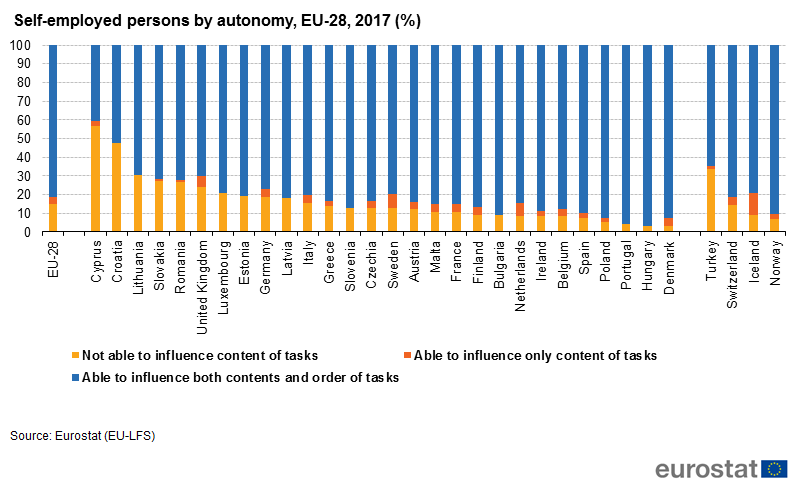
Share of Self-employed persons by autonomy EU-28 2017.png
(
file
)
42 KB
2
19:30, 4 December 2018
Share of employed persons reported being highly satisfied by professional status countries.png
(
file
)
39 KB
2
18:52, 4 December 2018
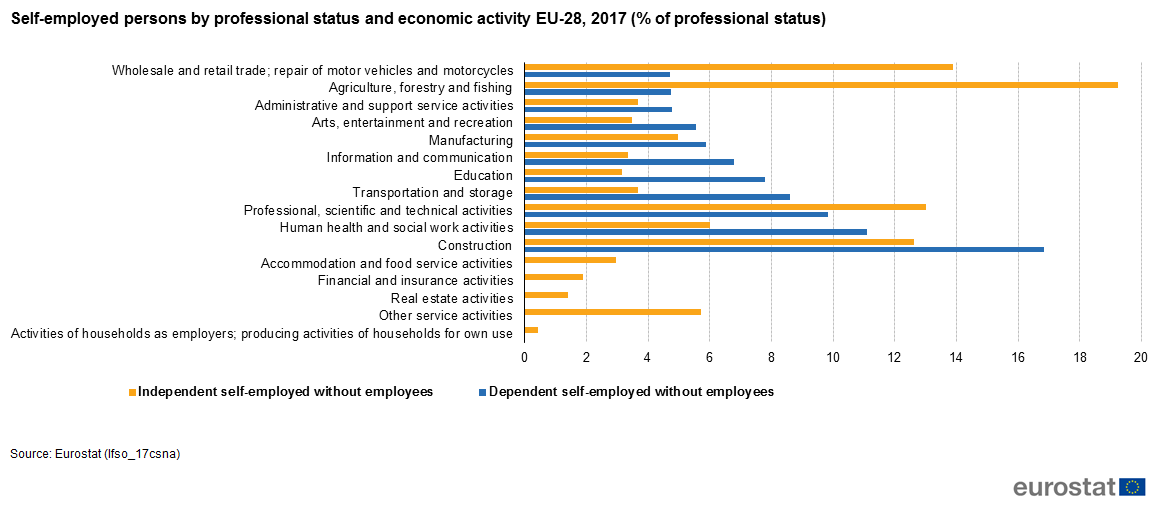
Self-employed persons by professional status and economic activity EU-28, 2017 (% of professional status).png
(
file
)
34 KB
2
14:55, 3 December 2018
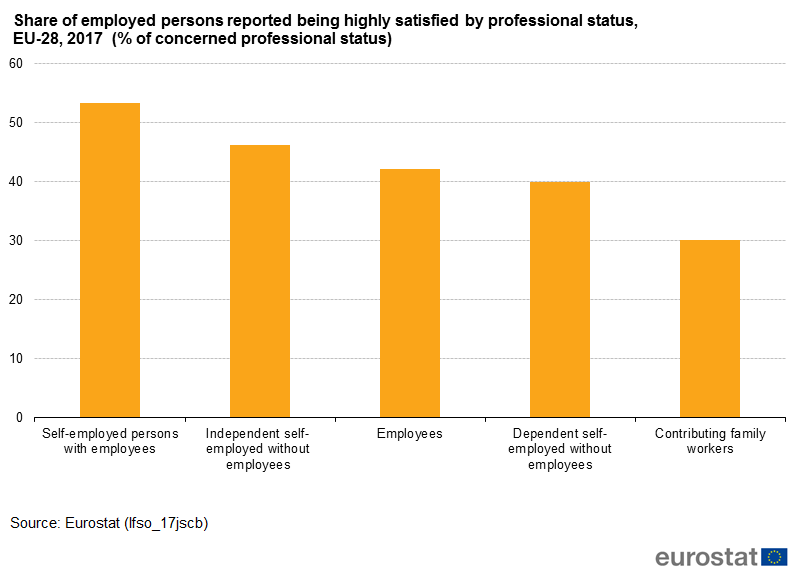
Share of employed persons reported being highly satisfied by professional status.png
(
file
)
23 KB
2
10:12, 3 December 2018
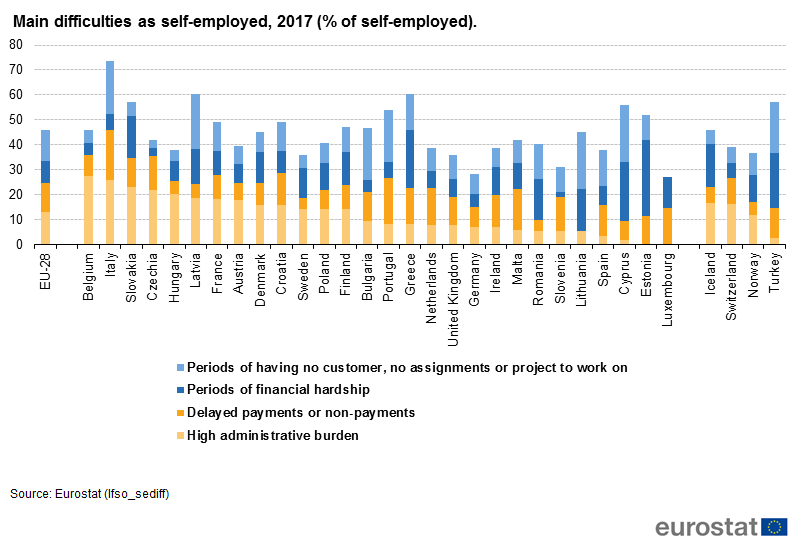
Main difficulties as self-employed, 2017.png
(
file
)
36 KB
1
12:20, 1 December 2018
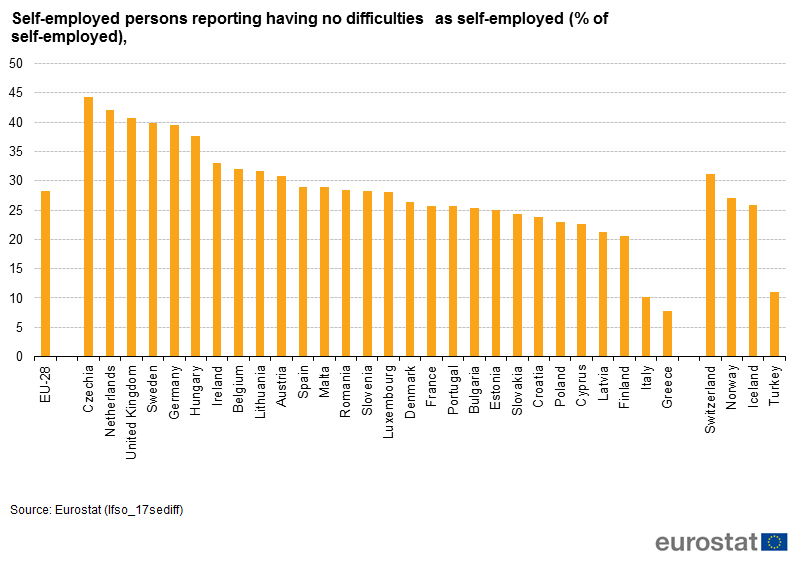
Self-employed persons reporting having no difficulties as self-employed.png
(
file
)
38 KB
1
11:41, 1 December 2018
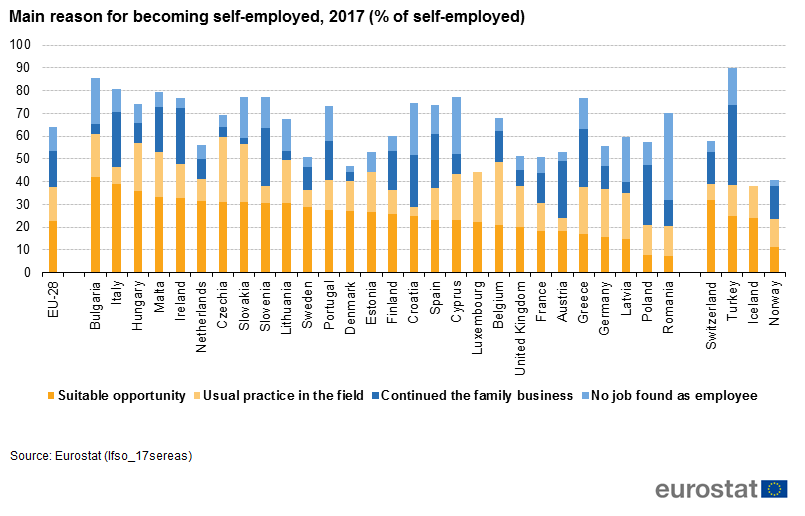
Main reason for becoming self-employed, 2017 (% of self-employed).png
(
file
)
39 KB
1
16:55, 30 November 2018
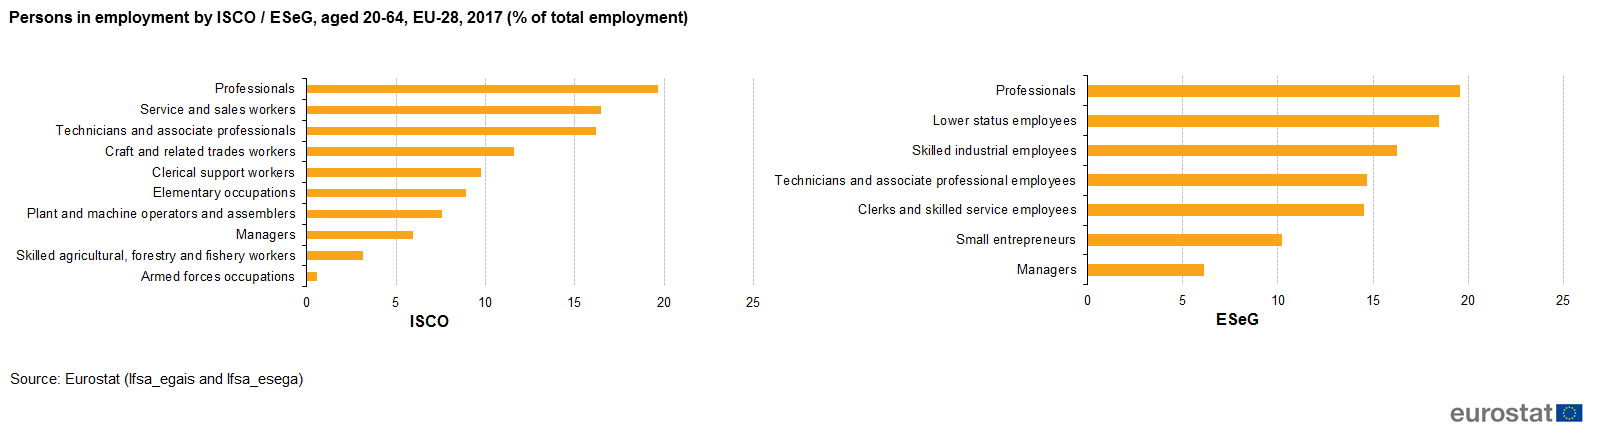
Persons in employment by ISCO ESeG , age group 20-64,EU-28, 2017 (% of total employment) YB17 v2.png
(
file
)
32 KB
1
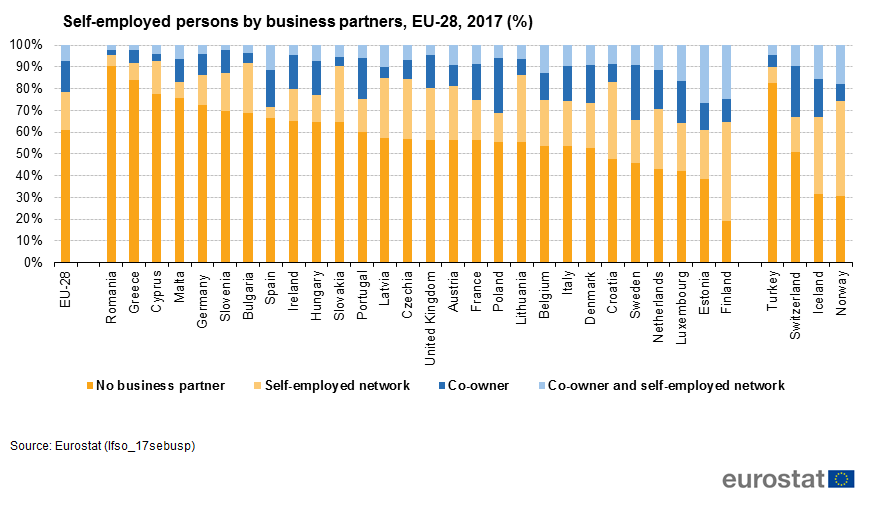
10:51, 30 November 2018
Self-employed persons by business partners, EU-28, 2017.png
(
file
)
46 KB
1
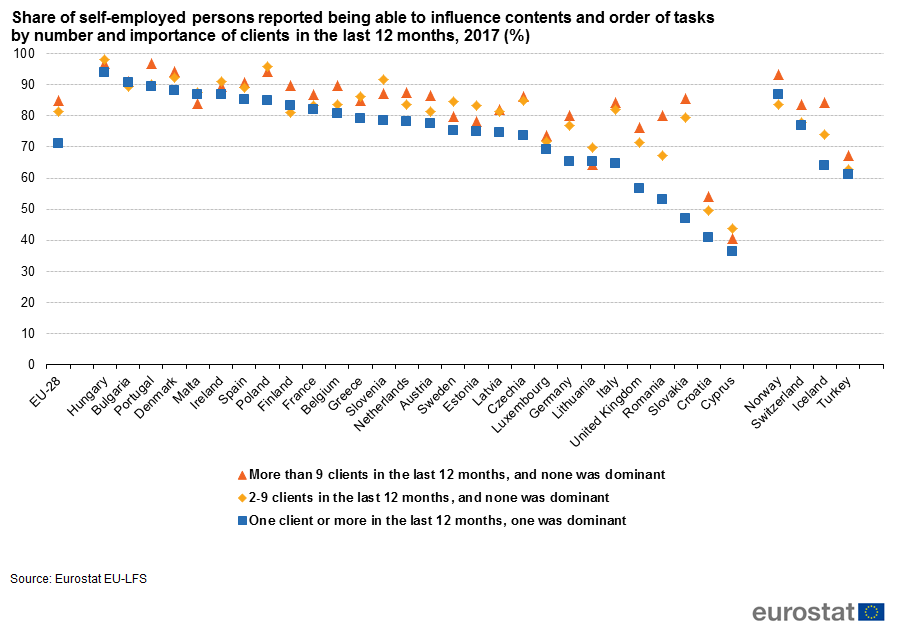
10:36, 30 November 2018
Share of self-employed persons reported being able to influence contents and order of tasks by number and importance of clients in the last 12 months, 2017.png
(
file
)
42 KB
1
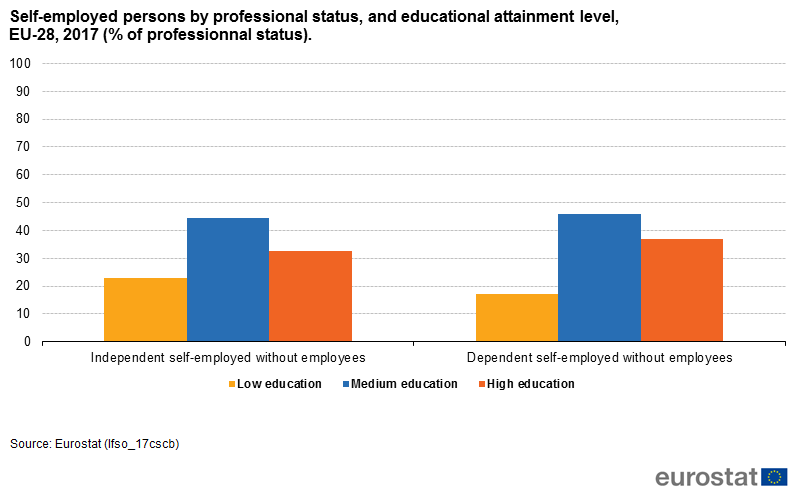
17:58, 29 November 2018
Self-employed persons by professional status, and educational attainment level, EU-28, 2017 (% of professional status) .png
(
file
)
19 KB
1
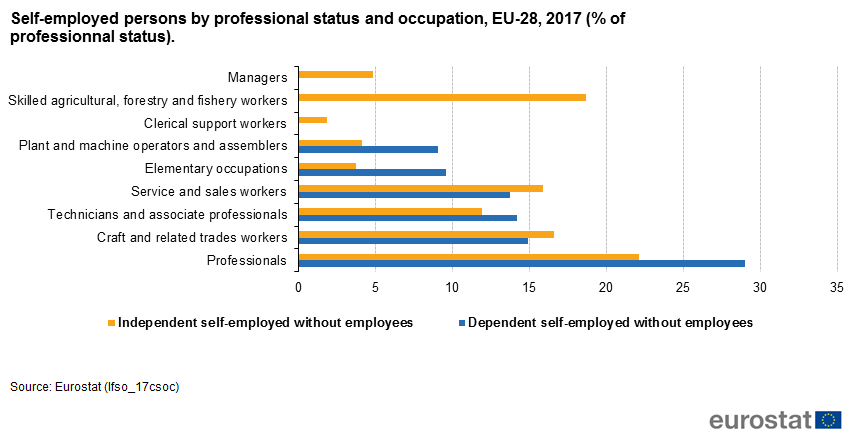
16:51, 29 November 2018
Self-employed persons by professional status and occupation, EU-28, 2017 (% of professional status) .png
(
file
)
24 KB
1
10:34, 29 November 2018
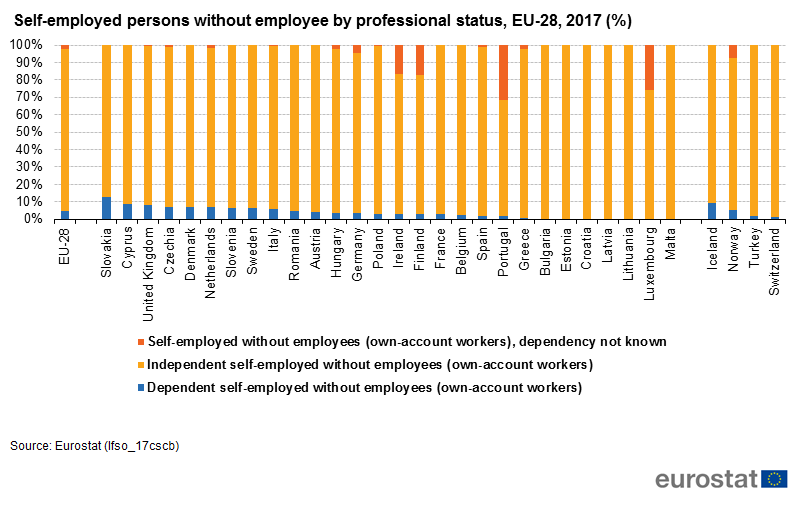
Self-employed persons without employees by professional status, EU-28, 2017.png
(
file
)
46 KB
1
12:34, 28 November 2018
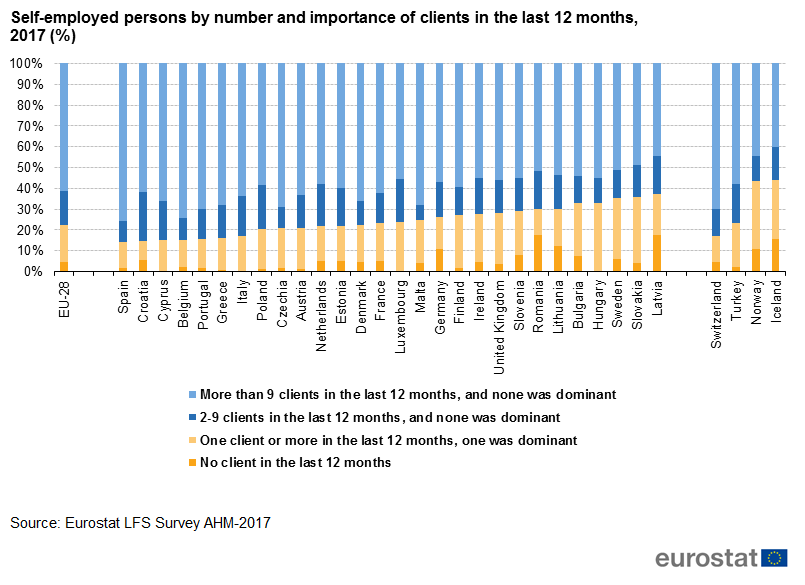
Self-employed persons by number and importance of clients in the last 12 months, 2017 (%)).png
(
file
)
49 KB
1
11:05, 28 November 2018
Self-employed persons having at least one client in the last 12 months by control over working time, 2017 (%).png
(
file
)
43 KB
1
18:13, 26 November 2018
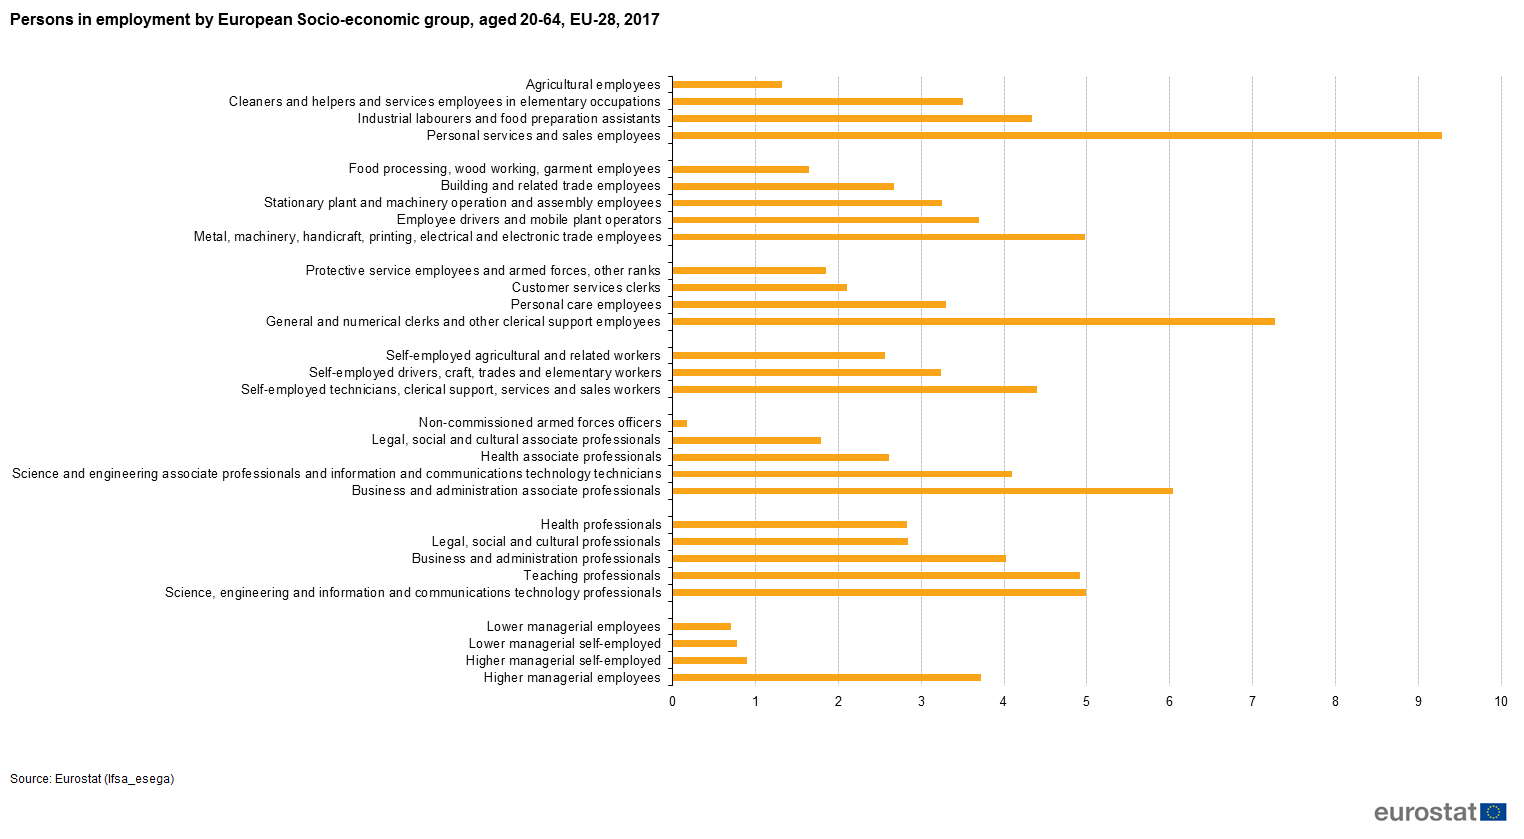
Persons in employment by eseg, age group 20-64,EU-28, 2017 (% of total employment) YB17 v2.png
(
file
)
67 KB
1
14:05, 21 November 2018
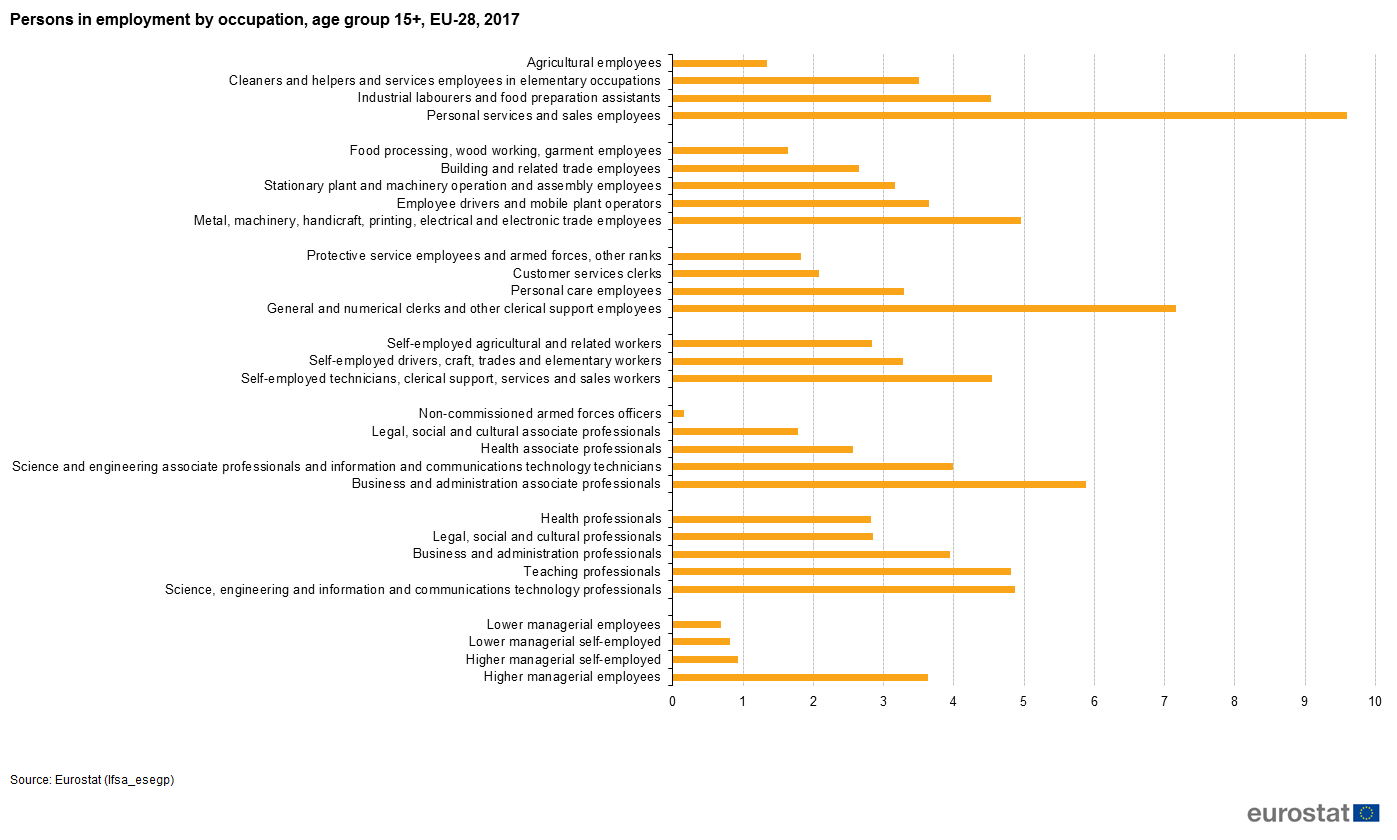
Persons in employment by occupation, age group 15+, EU-28, 2017 (% of total employment) YB17 v2.png
(
file
)
65 KB
1
13:59, 21 November 2018
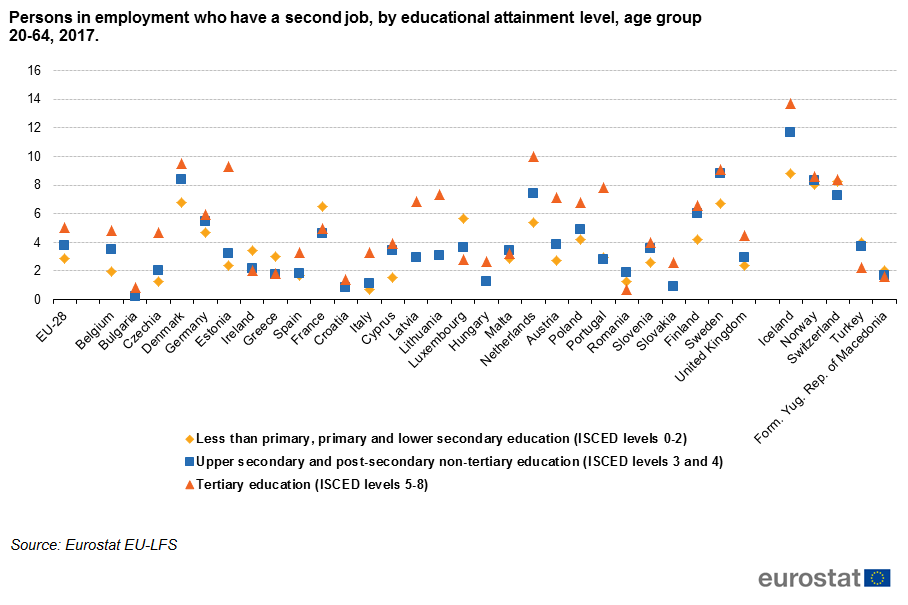
Persons in employment who have a second job, by educational attainment level, age group 15-74, 2017 (% of total employment).png
(
file
)
43 KB
3
12:39, 20 November 2018
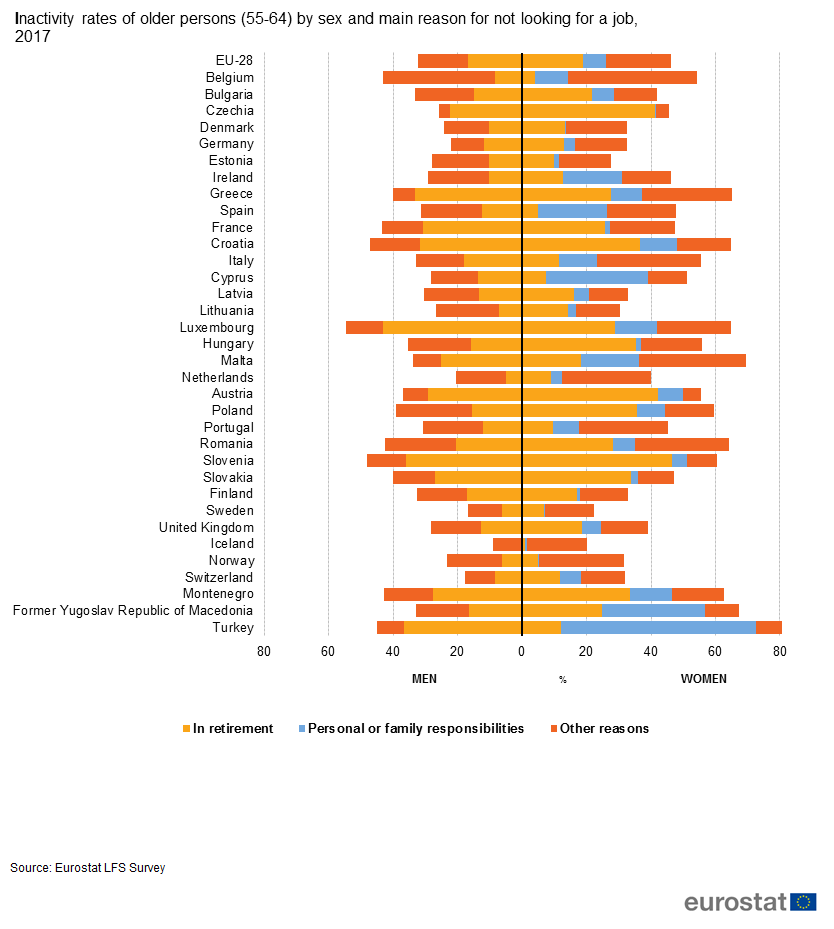
Inactivity rates of older persons (55-64) by sex and main reason for not looking for a job, 2017.png
(
file
)
42 KB
3
12:39, 20 November 2018
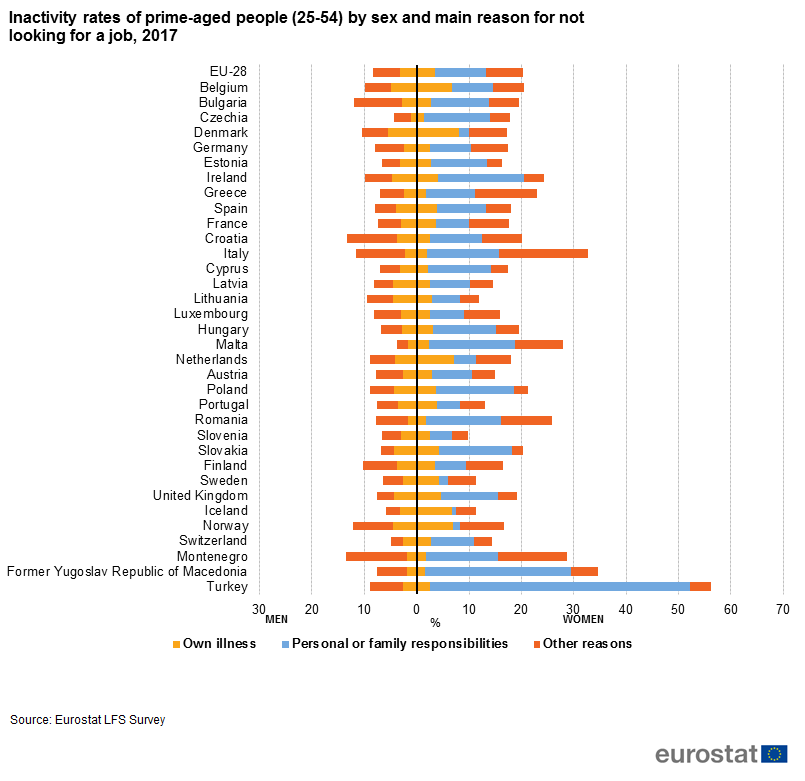
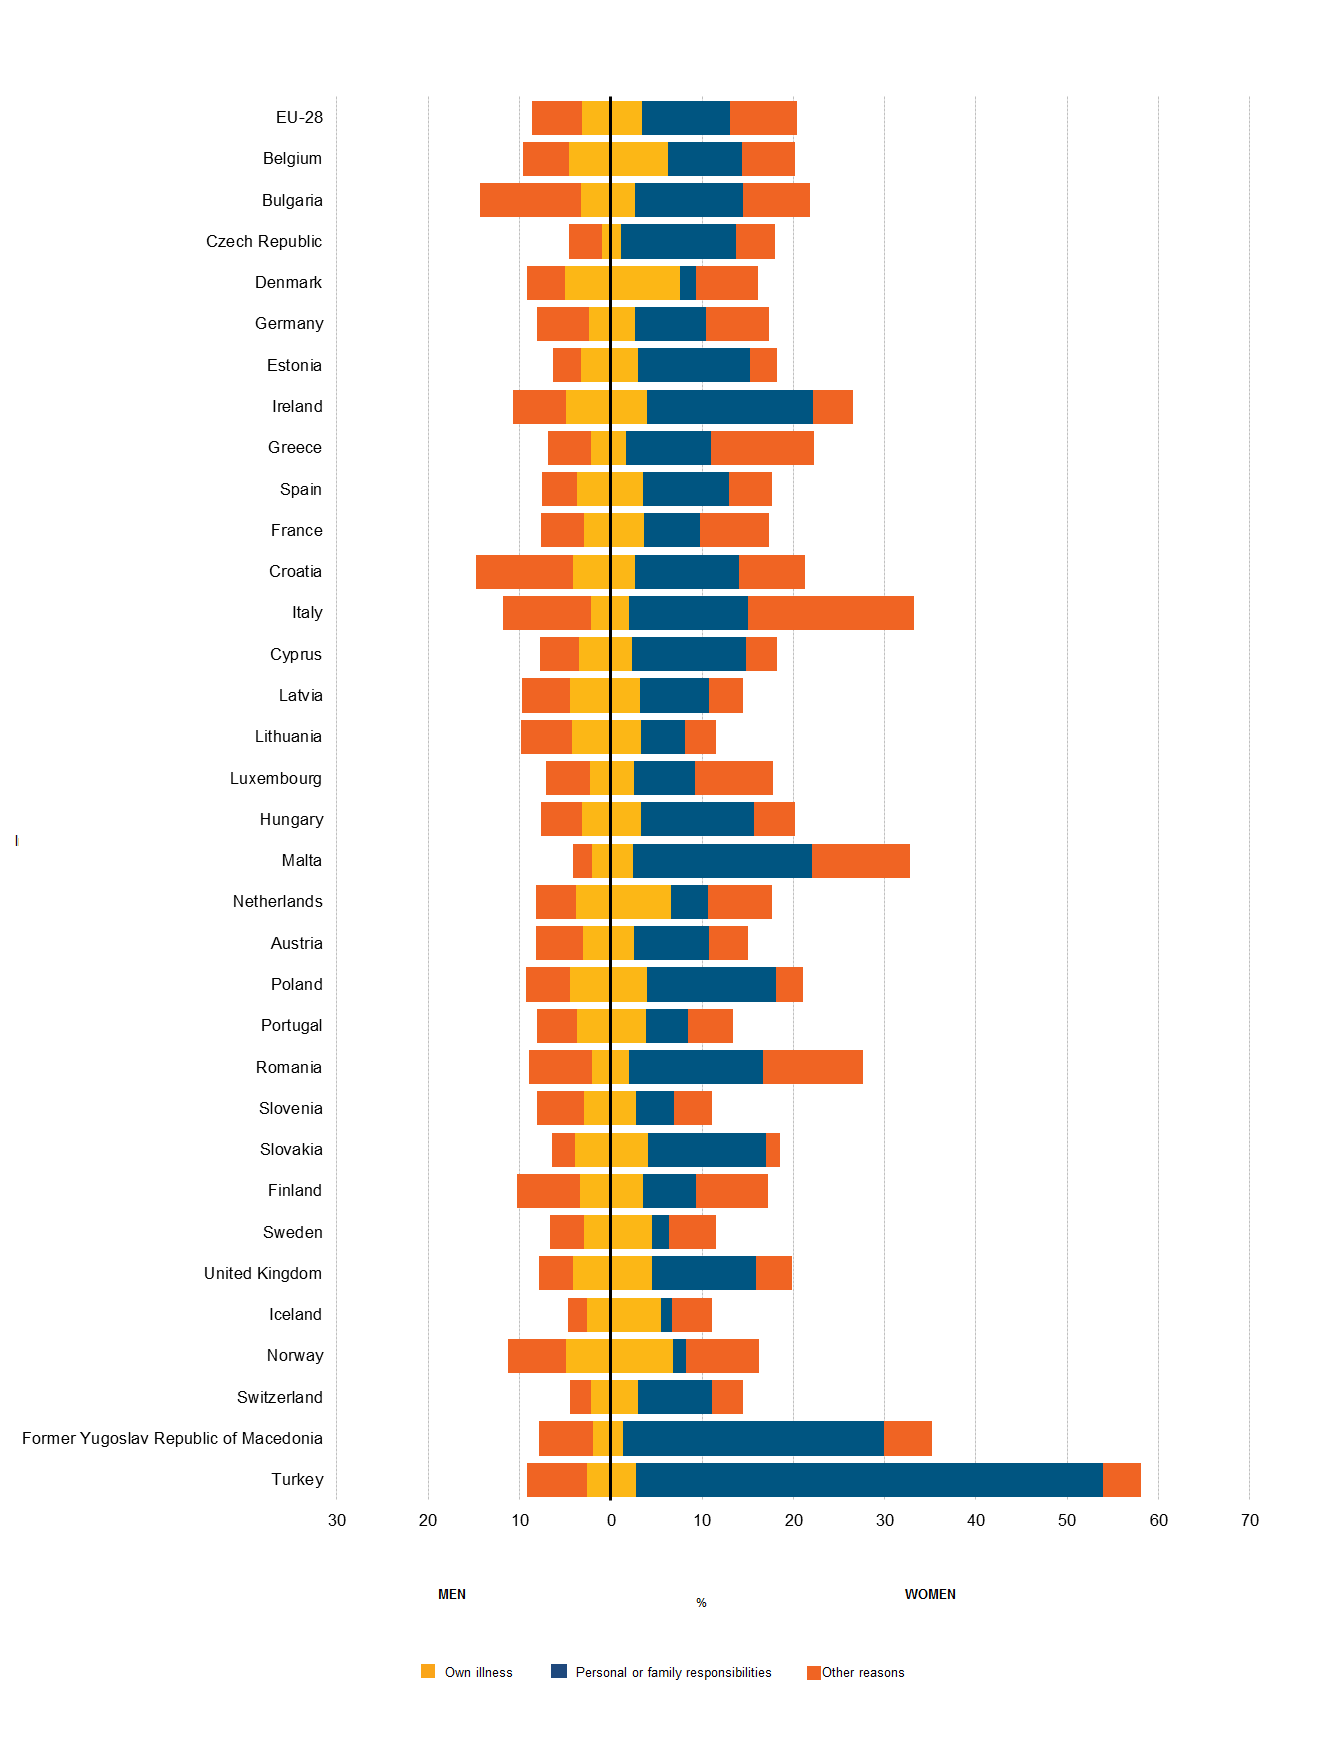
Inactivity rates of prime-aged people (25-54) by sex and main reason for not looking for a job, 2017.png
(
file
)
41 KB
3
12:38, 20 November 2018
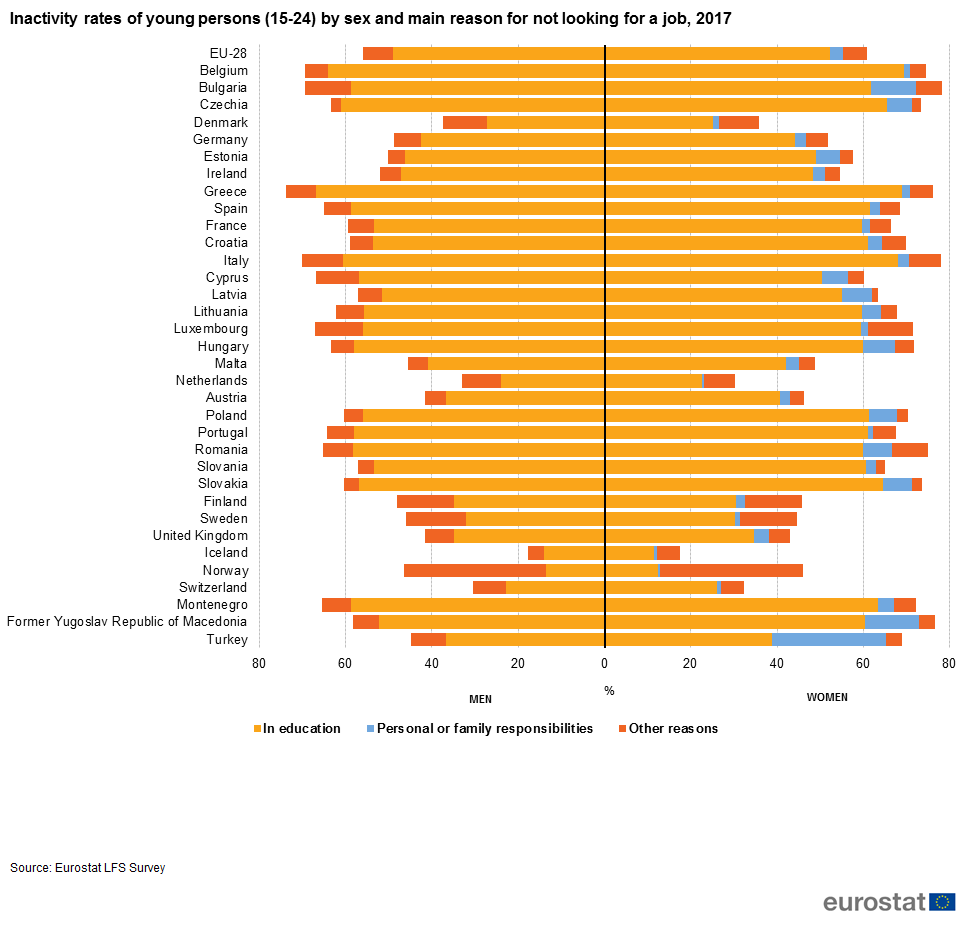
Inactivity rates of young persons (15-24) by sex and main reason for not looking for a job, 2017.png
(
file
)
45 KB
3
10:01, 20 November 2018
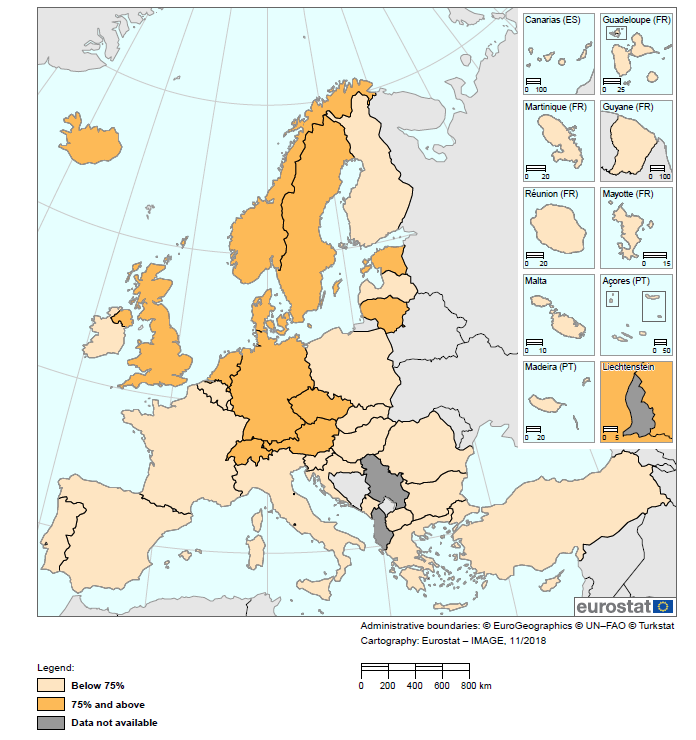
Employment rate, age group 20 – 64, 2017 (%) YB18.png
(
file
)
163 KB
Map 2 with two groups
3
16:35, 8 November 2018
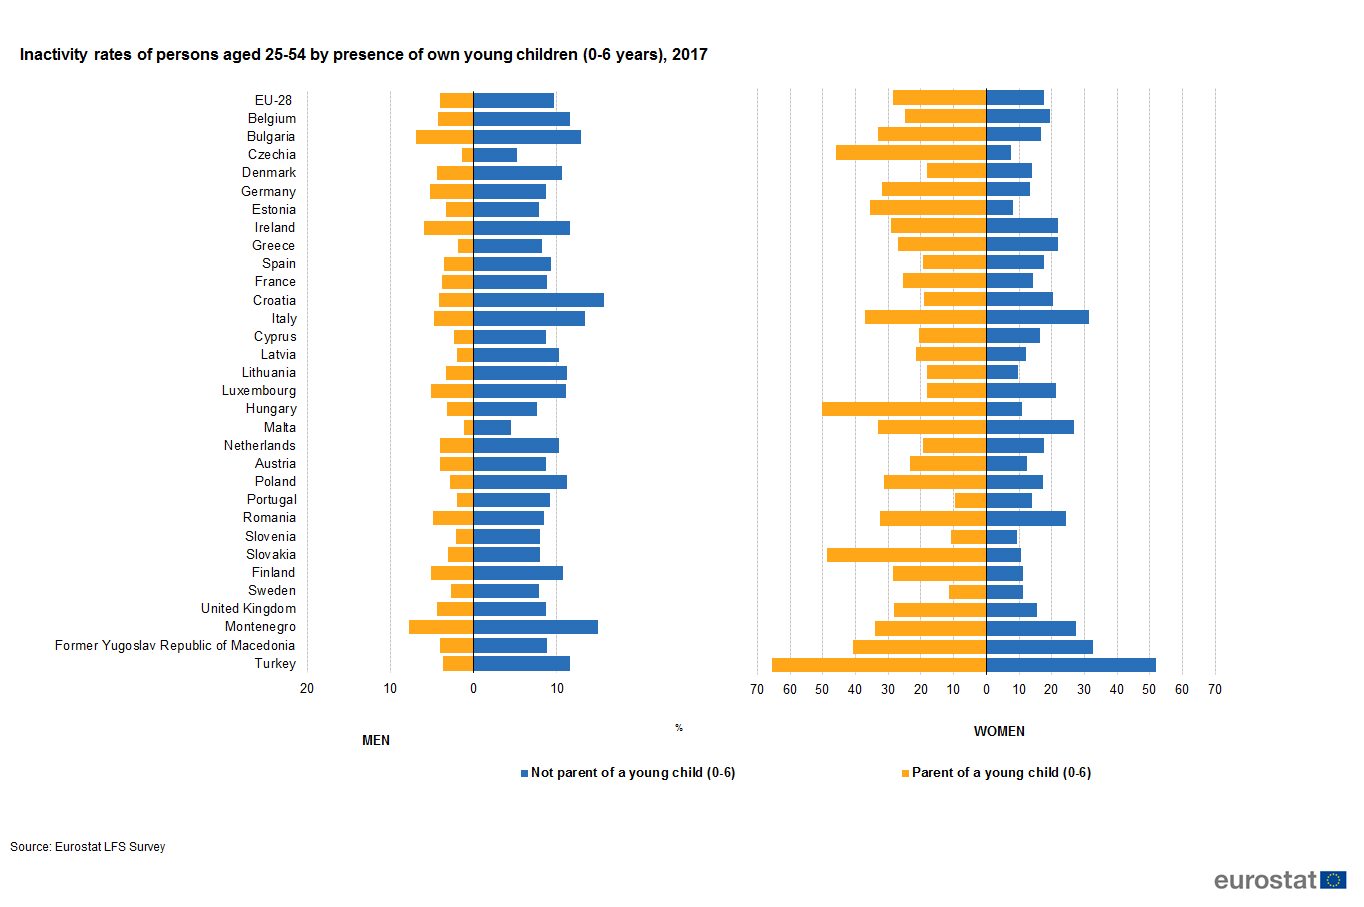
Inactivity rates of persons aged 25-54 by presence of own young children (0-6 years), 2017 update.png
(
file
)
64 KB
2
16:33, 8 November 2018
Inactivity rates of prime-aged people (25-54) by sex and main reason for not looking for a job, 2016 new.png
(
file
)
82 KB
Reverted to version as of 09:50, 27 September 2017
4
17:04, 6 November 2018
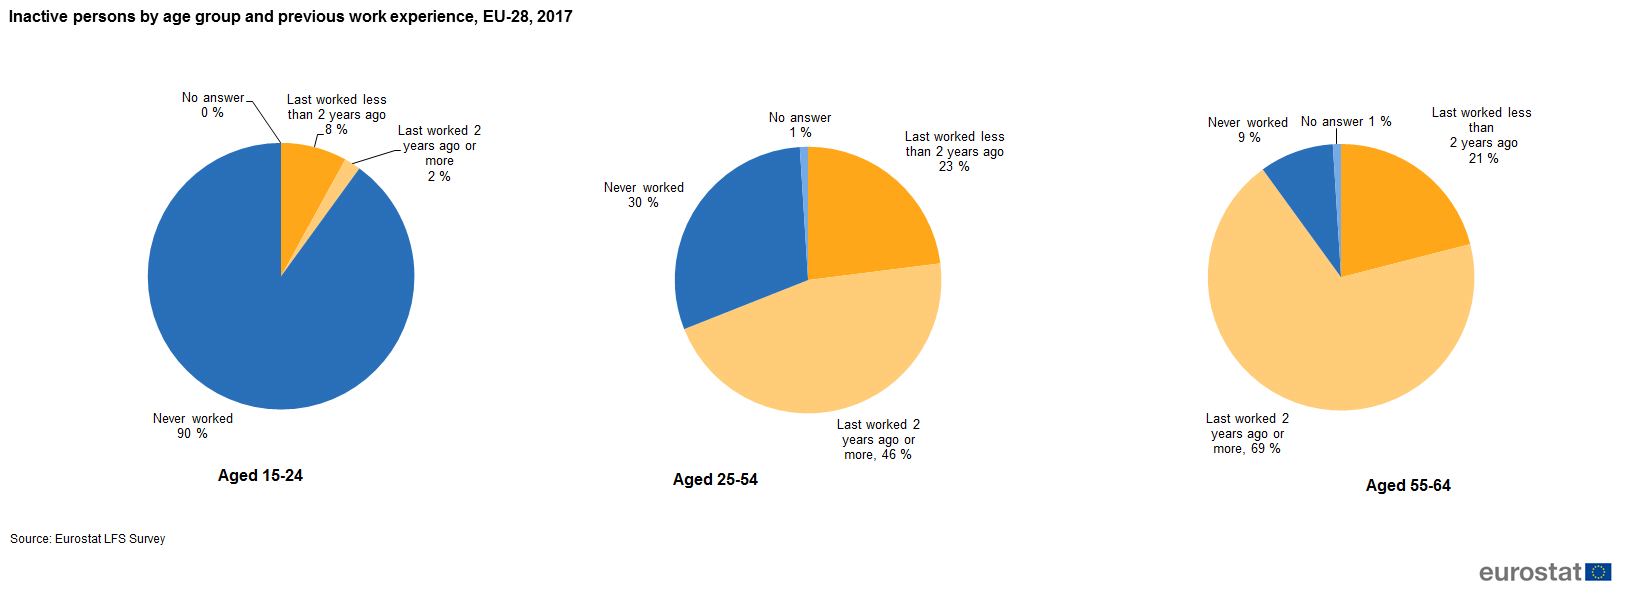
Inactive persons by age group and previous work experience, EU-28, 2017.png
(
file
)
45 KB
1
First page
Previous page
Next page
Last page
Special page
ISSN 2443-8219


.png)

_new.png)

_final.png)
_new.png)
.png)
.png)
,_age_group_20-64,_EU-28,_2018.png)
,_age_group_20-64,_EU-28,_2018.png)
,_age_group_20-64,_EU-28,_2017_.png)
.png)
.png)
.png)
.jpg)
_.jpg)


.png)


.png)
_YB17_v2.png)


_.png)
_.png)

).png)
.png)
_YB17_v2.png)
_YB17_v2.png)
.png)
_by_sex_and_main_reason_for_not_looking_for_a_job,_2017.png)
_by_sex_and_main_reason_for_not_looking_for_a_job,_2017.png)
_by_sex_and_main_reason_for_not_looking_for_a_job,_2017.png)
_YB18.png)
,_2017_update.png)
_by_sex_and_main_reason_for_not_looking_for_a_job,_2016_new.png)

.jpg)