Heating and cooling degree days - statistics
Data extracted in February 2023.
Planned article update: June 2024.
Highlights
The use of indicators or indexes such as 'heating degree days' and 'cooling degree days' can contribute to the correct interpretation of energy consumption for cooling and heating buildings. Heating degree days (HDD) and cooling degree days (CDD) are weather-based technical indexes designed to describe the energy requirements of buildings in terms of heating (HDD) or cooling (CDD). This article presents the variations of HDD and CDD since 1979, based on data available. Each year, the Joint Research Centre provides the data necessary to produce this article.
Full article
Heating and cooling degree days at EU level
Heating degree days values are decreasing across time
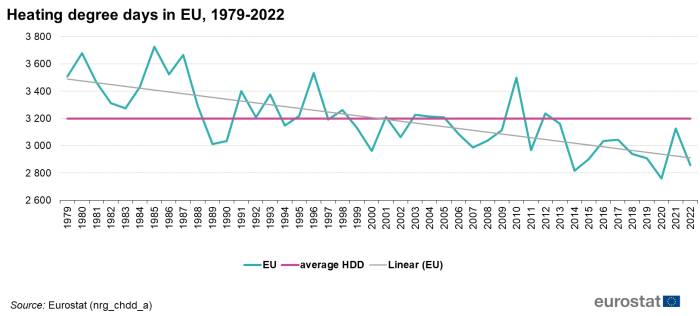
Heating degree days (HDD) values decreased by 19 % between 1979 and 2022 in the EU, indicating that, compared with 1979, only 81 % of the heating needs were observed in 2022. The arithmetic average across 42 years of data is 3 199. The trend shows that heating degree days are decreasing across time. After 1999, with the exception of four years (2010, 2004, 2003 and 2001), heating degree days were lower than average (see Figure 1).
Cooling degree days values are increasing across time
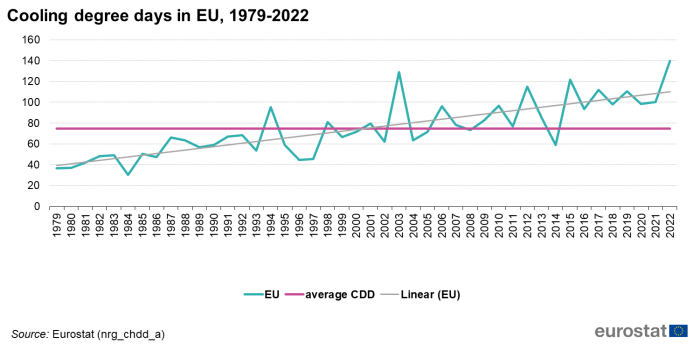
By contrast, cooling degree days (CDD) values in 2022 were almost four times higher between 1979 (37) and 2022 (140), indicating that the needs for cooling (air conditioning) in a given building increased over the last decades. For cooling degree days, the trend observed from our measurements shows an increase across time. The average CDD value for the EU is 75. After 2001, only a few years (2002, 2004, 2005 and 2014) were below average (see Figure 2).
Heating and cooling degree days by EU Member State
Highest heating degree days values in Finland and Sweden
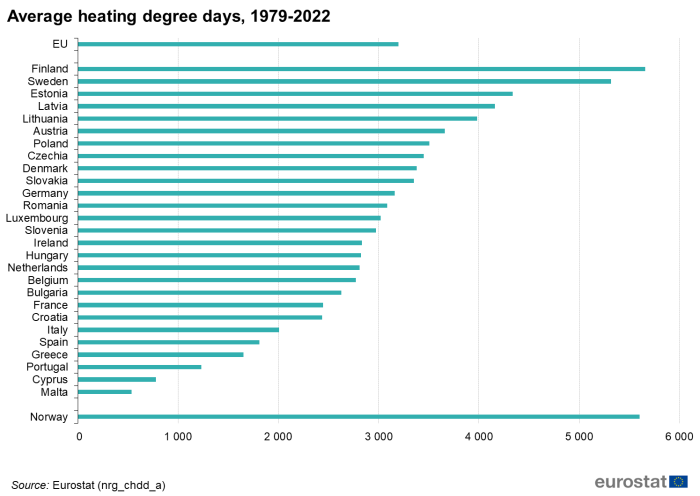
Heating degree days vary across EU Member States. Considering all data available over the 1979-2022 period, Finland had the highest average annual HDD value (5 656), while for Malta, the value of this index was 534. This means that for a given building, the need for heating was ten times less in Malta than in Finland between 1979 and 2022 (see Figure 3). Finland was followed by Sweden (with an average HDD of 5 316) and Estonia (4 338). The EU Member States with the lowest HDD were Malta (534), followed by Cyprus (778) and Portugal (1 233).
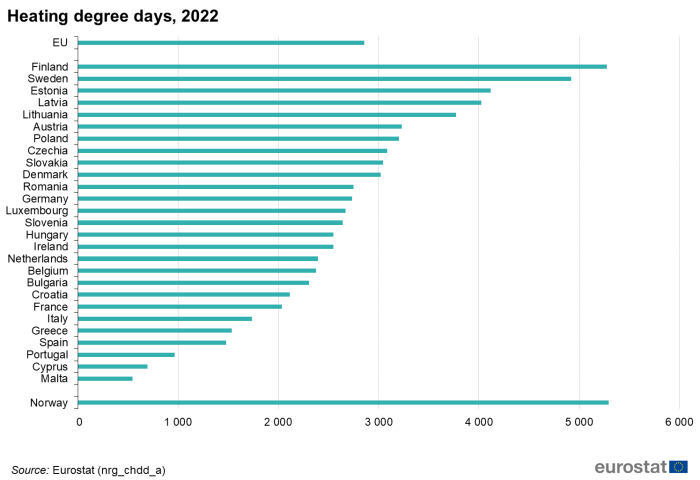
Considering the latest year under observation (2022), the countries with the highest HDD values were Finland (5 277), Sweden (4 919) and Estonia (4 118) (see Figure 4). This means that in 2022, a given building would have greater needs for heating in Finland, Sweden and Estonia compared with the rest of the EU, since lower temperatures (below 15°C) were more frequent. The Member States with the lowest HDD values in 2022 were Malta (544), Cyprus (696) and Portugal (968).
The correlations between the countries' annual heating degree days data are available in Table 1. They are organised in increasing arithmetic average value order. On the correlation analysis, neighbouring countries have higher heating degree days values. Countries of similar latitude have similar arithmetic average values, but if their longitude is different, the correlation varies. For example, looking at Portugal and Cyprus, even if their average values are similar, the correlation is relatively low 0.12. On the other hand, Luxembourg, Belgium and the Netherlands have high correlation.

Highest cooling degree days in Malta and Cyprus
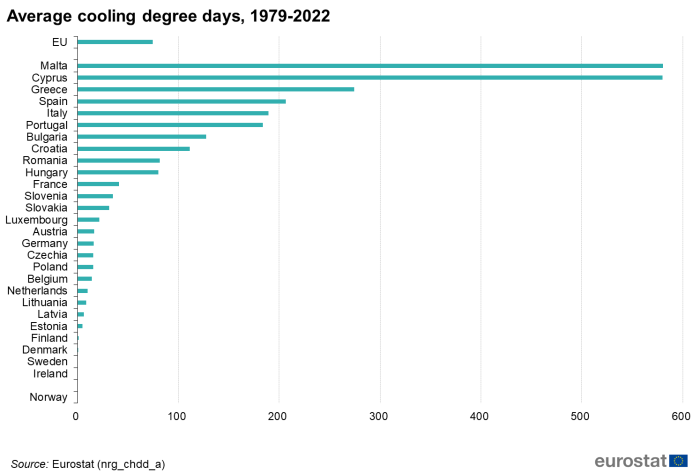
Similar to heating, cooling degree (CDD) days vary across the EU. Figure 5 shows the annual averages across 43 years, from 1979 to 2022. Malta had the highest CDD (580.4), followed by Cyprus (579.9) and Greece (274). The lowest values for this index were calculated for Ireland (0.03), Sweden (0.4) and Denmark (0.97). This means that for a given building, the average need for cooling (or air conditioning) in Ireland, Sweden and Denmark were negligible between 1979 and 2022.
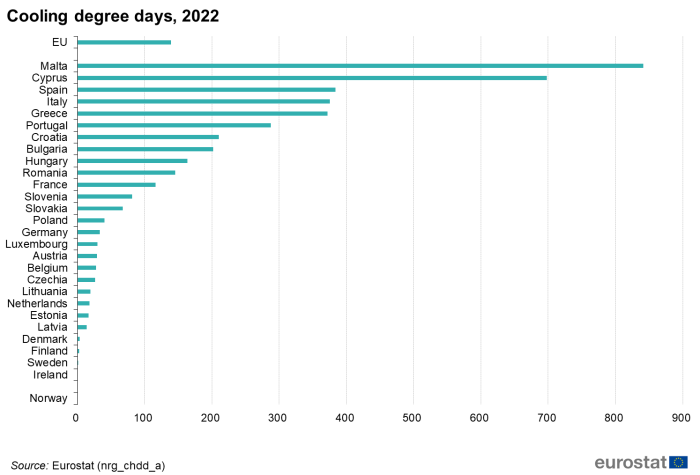
Considering the latest year under observation (2022), the countries with the highest CDD values were Malta (842), Cyprus (698) and Spain (384) (see Figure 6). This means that in 2022, a given building would have greater need for cooling (or air conditioning) in Malta, Cyprus and Spain compared with the rest of the EU, because higher temperatures (over 24°C) were more frequent. The lowest CDD index calculated was observed for Ireland (0.03) followed by Sweden (1.57) and Finland (2.47) in 2022.
The correlations between the countries' annual cooling degree days data are available in Table 2. On the correlation analysis, neighbouring countries have higher cooling degree days values, for example Lithuania, Latvia and Estonia. Countries of similar latitude have similar arithmetic average values but if their longitude is different, the correlation varies. Cooling degree days datasets correlation between Portugal and Greece is 0.12.

Heating and cooling degree days by NUTS 1 regions
NUTS 1 regions classification based on their average HDD values
On NUTS (Nomenclature of territorial units for statistics) 1 regional level, Table 3 classifies the regions in increasing HDD values. As expected, the regions of Canarias in Spain (171), Região Autónoma da Madeira in Portugal (313.8), Malta (534) and Cyprus (778) have the lowest average HDD values. It is interesting to observe that other regions in Member States, geographically distant have similar average values, such as Makroregion Poludniowo-Zachodni in Poland (3 507), Slovensko in Slovakia (3 354) and Bayern in Germany (3 357). Ireland (2 833) has similar average values as West-Nederland (2 711) and Yugozapadna i yuzhna tsentralna Bulgaria (2 767). The same applies to Lithuania (3 981) and the regions Westösterreich in Austria (3 987) and Östra Sverige in Sweden (4 117). Values for all regions are available in the attached excel file.

NUTS 1 regions classification based on their average CDD values
On NUTS 1 regional level, Table 4 classifies the regions in increasing CDD values. Ireland (0.02), the region Norra Sverige in Sweden (0.09), as well as Norge (0.09) have the lowest average CDD values. It is interesting to observe that other geographically distant regions have similar average values, such as Makroregion Województwo Mazowieckie in Poland (16.5) and Noroeste in Spain (17.1). The same applies to the regions Yugozapadna i yuzhna tsentralna Bulgaria (95.1) and Provence-Alpes-Côte d'Azur (91.6). Values for all regions are available in the attached excel file.

Heating and cooling degree days by NUTS 3 regions
Higher HDD values in Finnmark, Norway
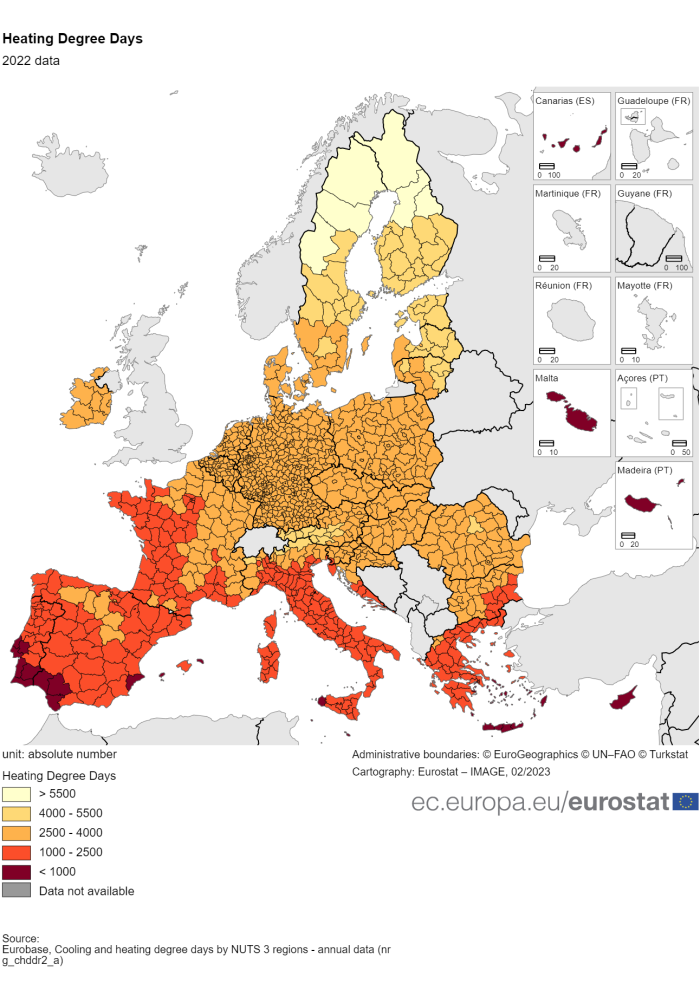
On NUTS 3 regional level, the annual averages for all available data spanning across 43 years, from 1979 to 2022 show that Finnmark in Norway had the highest HDD value (6 778), while the lowest value was observed in Fuerteventura, Spain (17.4). In 2022, the highest HDD value measured was 6 257 in Finnmark, while the lowest was observed in La Gomera in Spain with 1.7.
Higher cooling degree days values in Malta and Cyprus
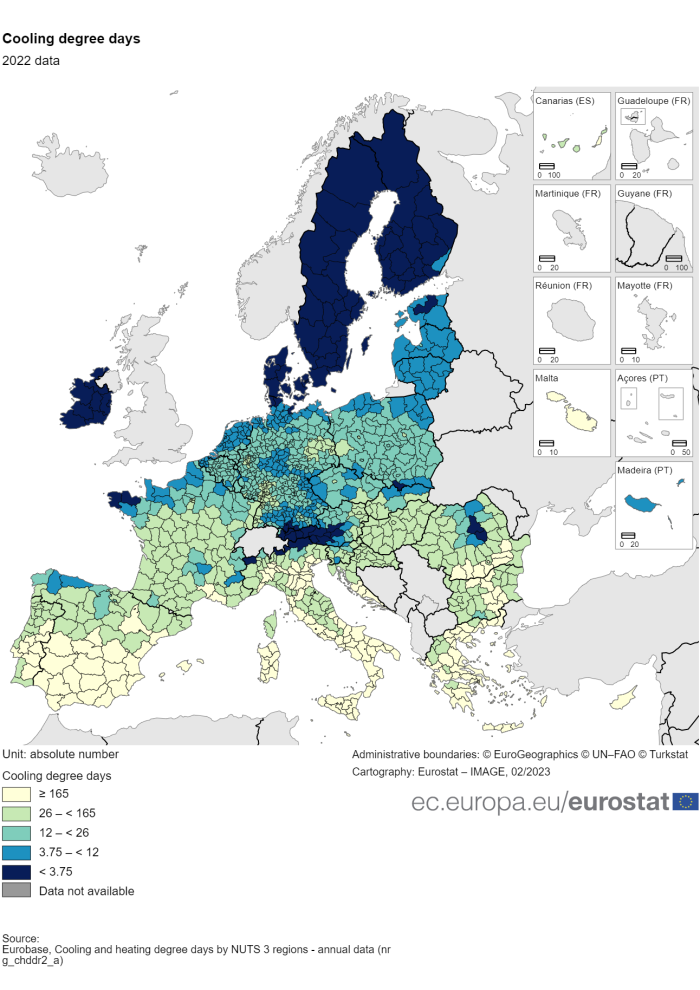
On NUTS 3 regional level, the annual averages for all available data spanning 43 years, from 1979 to 2022 showed that Gozo and Comino / Ghawdex u Kemmuna region in Malta had the highest CDD value (594). The second EU Member State where, for a given building, the need for cooling (or air conditioning) was significant was Cyprus (580). In 2022, the highest cooling degree days value was measured in Gozo and Comino / Ghawdex u Kemmuna (842).
Source data for tables and graphs
Context
Over the last decades, the effects of global warming caused relevant impacts in many sectors. Given the previsions, this tendency is expected to persist at least until the end of this century. Identifying climate-related impacts and assessing how important these impacts are is an important element of any effective strategy for managing future climate risks. Weather-related energy consumption for heating and cooling buildings indicators such as HDD and CDD can contribute to monitoring energy demand for cooling and heating buildings under climate change.
Methodology
Heating degree days (HDD) index is a weather-based technical index designed to describe the need for the heating energy requirements of buildings. Cooling degree days (CDD) index is a weather-based technical index designed to describe the need for the cooling (air-conditioning) requirements of buildings.
We derive HDD and CDD data from meteorological observations of air temperature, interpolated to regular grids at 25 km resolution for Europe. We aggregate calculated gridded HDD and CDD and we present them on NUTS-3 level.
Heating Degree Days (HDD) index: the severity of the cold in a specific time period taking into consideration outdoor temperature and average room temperature (in other words the need for heating). The calculation of HDD relies on the base temperature, defined as the lowest daily mean air temperature not leading to indoor heating. The value of the base temperature depends in principle on several factors associated with the building and the surrounding environment. By using a general climatological approach, the base temperature is set to a constant value of 18°C in the HDD calculation.
If Tm ≤ 15°C Then [HDD = ∑i(18°C - Tim)] Else [HDD = 0] where Tim is the mean air temperature of day i. Examples: If the daily mean air temperature is 12°C, for that day the value of the HDD index is 6 (18°C-12°C). If the daily mean air temperature is 16°C, for that day the HDD index is 0. Only days with a daily mean air temperature equal or below 15°C are considered for this calculation.
Cooling degree days (CDD) index: the severity of the heat in a specific time period taking into consideration outdoor temperature and average room temperature (in other words the need for cooling). The calculation of CDD relies on the base temperature, defined as the highest daily mean air temperature not leading to indoor cooling. The value of the base temperature depends in principle on several factors associated with the building and the surrounding environment. By using a general climatological approach, the base temperature is set to a constant value of 21°C in the CDD calculation.
If Tm ≥ 24°C Then [CDD = ∑iTim - 21°C)], Else [CDD = 0] where Tim is the mean air temperature of day i. Examples: If the daily mean air temperature is 26°C, for that day the value of the CDD index is 5 (26°C-21°C). If the daily mean air temperature is 22°C, for that day the CDD index is 0. Only days with a daily mean air temperature equal or above 24°C are considered for this calculation.
These calculations are executed on a daily basis, added up to a calendar month and subsequently to calendar years. Annual data are calculated as the sum of monthly data by Eurostat.
Data sources
This dataset includes monthly data as published by the Joint Research Centre's AGRI4CAST Resources Portal. Note that Eurostat is not the producer of the monthly data, but only re-publishes the data.
Direct access to
Database
- Energy (nrg), see:
Cooling and heating degree days by country - annual data (nrg_chdd_a)
Cooling and heating degree days by country - monthly data (nrg_chdd_m)
Cooling and heating degree days by NUTS 3 regions - annual data (nrg_chddr2_a) - data for NUTS 1, NUTS 2 and NUTS 3 are in the same dataset
Cooling and heating degree days by NUTS 3 regions - monthly data (nrg_chddr2_m)
Dedicated section
Methodology
- Energy statistics - cooling and heating degree days (ESMS metadata file — nrg_chdd)

