_GL2023.png)
 GL2023.png&body=Statistics Explained - Average rate of change for trade in services, 2012–2022 (% per year) GL2023.png %0A https%3A%2F%2Fec.europa.eu%2Feurostat%2Fstatistics-explained%2Findex.php%3Ftitle%3DFile%3AAverage_rate_of_change_for_trade_in_services%2C_2012%25E2%2580%25932022_%28%2525_per_year%29_GL2023.png)
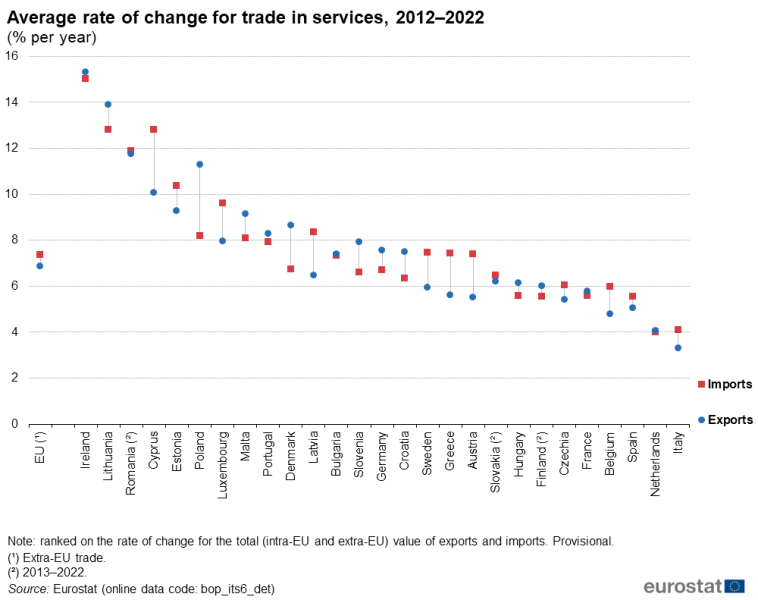
File:Average rate of change for trade in services, 2012–2022 (% per year) GL2023.png

Size of this preview: 758 × 600 pixels. Other resolutions: 304 × 240 pixels | 1,000 × 791 pixels.
Original file (1,000 × 791 pixels, file size: 33 KB, MIME type: image/png)
null
File usage
The following page uses this file:
_GL2023.png&oldid=609674)
_GL2023.png)
_GL2023.png&action=edit&redlink=1)
_GL2023.png&action=history)