,_1995-2007,_EU-15.png)
, 1995-2007, EU-15.png&body=Statistics Explained - Trend in the shares of agricultural area managed by low, medium and high intensity farms (%), 1995-2007, EU-15.png %0A https%3A%2F%2Fec.europa.eu%2Feurostat%2Fstatistics-explained%2Findex.php%3Ftitle%3DFile%3ATrend_in_the_shares_of_agricultural_area_managed_by_low%2C_medium_and_high_intensity_farms_%28%2525%29%2C_1995-2007%2C_EU-15.png)
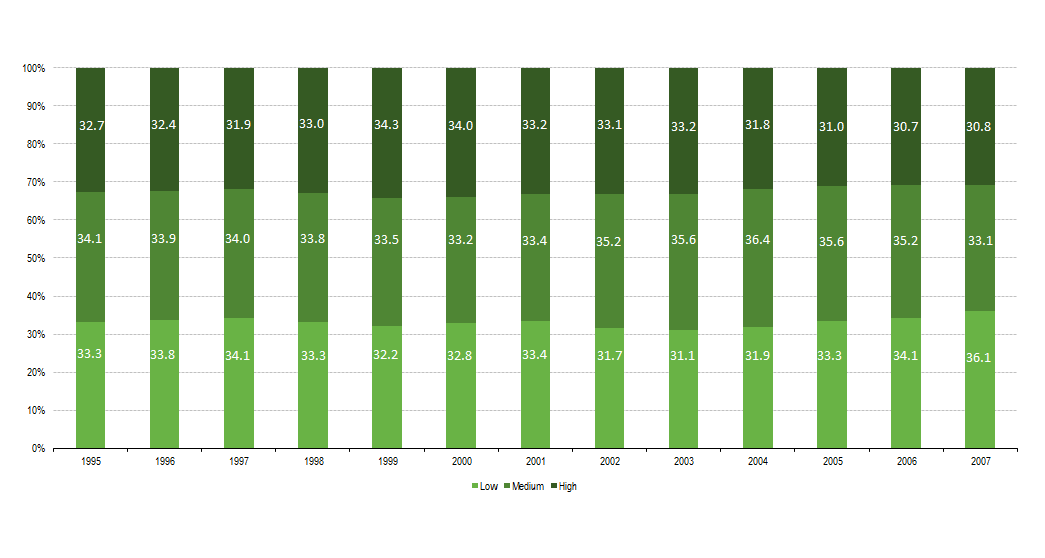
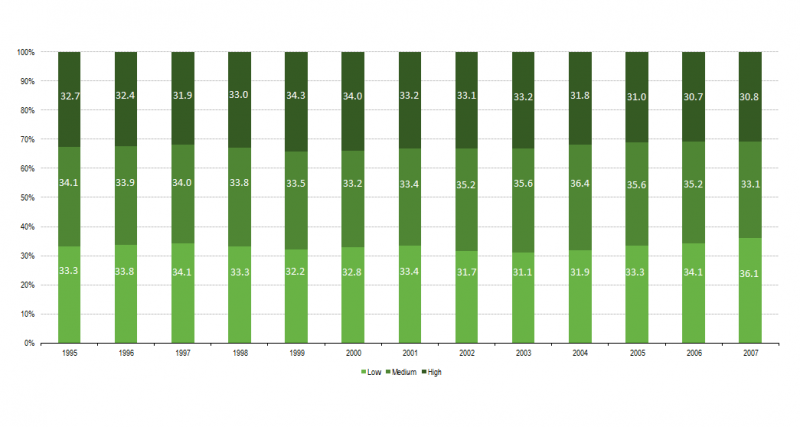
File:Trend in the shares of agricultural area managed by low, medium and high intensity farms (%), 1995-2007, EU-15.png
Size of this preview: 800 × 427 pixels. Other resolutions: 320 × 171 pixels | 1,045 × 558 pixels.
Original file (1,045 × 558 pixels, file size: 13 KB, MIME type: image/png)
Graph created with data from 1995 to 2007.
Data extracted in October 2012. Most recent data available at:
Farm Accountancy Data Network (FADN): http://ec.europa.eu/agriculture/rica/index.cfm
File usage
There are no pages that use this file.
,_1995-2007,_EU-15.png&oldid=114109)
,_1995-2007,_EU-15.png)
,_1995-2007,_EU-15.png&action=edit&redlink=1)
,_1995-2007,_EU-15.png&action=history)