File:Total population change, by NUTS 2 regions, average 2003–07, Per 1 000 inhabitants.PNG

Size of this preview: 604 × 600 pixels. Other resolutions: 242 × 240 pixels | 681 × 676 pixels.
Original file (681 × 676 pixels, file size: 205 KB, MIME type: image/png)
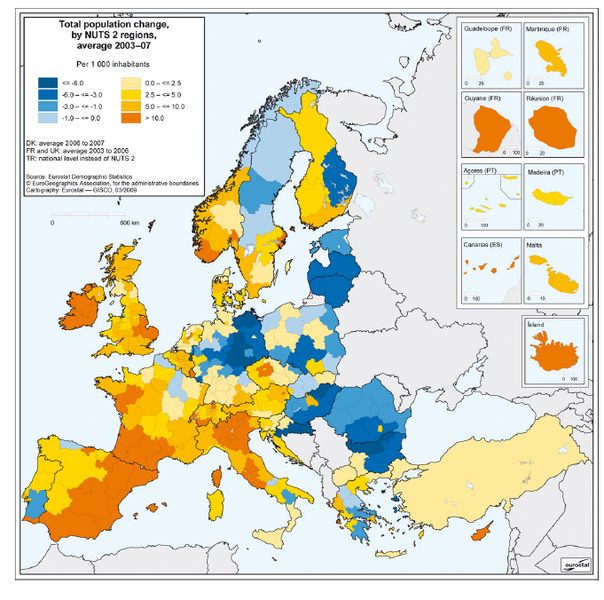
Total population change, by NUTS 2 regions, average 2003–07
- Per 1 000 inhabitants
Map created with data from March 2009
Most recent data available now, see:
Population at 1st January by sex and age from 1990 onwards (reg_d2jan)
File usage
There are no pages that use this file.