File:Top 5 producing countries of each of the top 30 products at CPA level by value of sold production, EU 27, 2010.png

Size of this preview: 800 × 452 pixels. Other resolutions: 320 × 181 pixels | 1,265 × 715 pixels.
Original file (1,265 × 715 pixels, file size: 31 KB, MIME type: image/png)
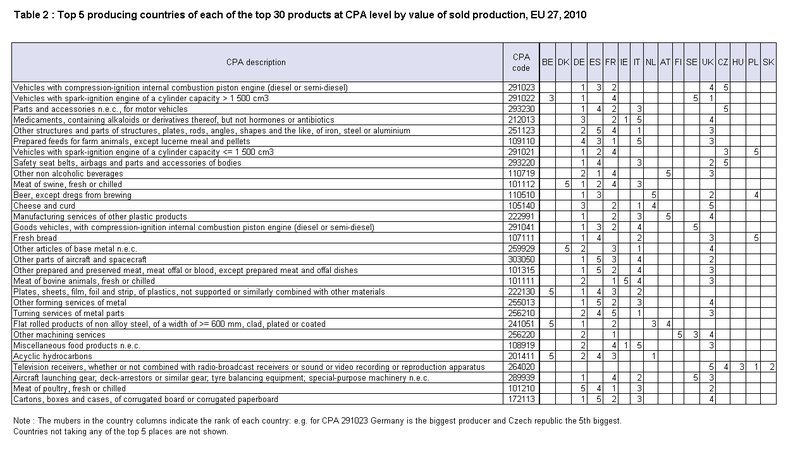
Top 5 producing countries of each of the top 30 products at CPA level by value of sold production, EU 27, 2010
File usage
There are no pages that use this file.