.png)
.png&body=Statistics Explained - Table 4- Evolution of implicit deflator, 2010=100 of household expenditure by consumption purpose – COICOP, EU-28, 2004-2013 – Source- Eurostat (nama 10 co3 p3).png %0A https%3A%2F%2Fec.europa.eu%2Feurostat%2Fstatistics-explained%2Findex.php%3Ftitle%3DFile%3ATable_4-_Evolution_of_implicit_deflator%2C_2010%253D100_of_household_expenditure_by_consumption_purpose_%25E2%2580%2593_COICOP%2C_EU-28%2C_2004-2013_%25E2%2580%2593_Source-_Eurostat_%28nama_10_co3_p3%29.png)
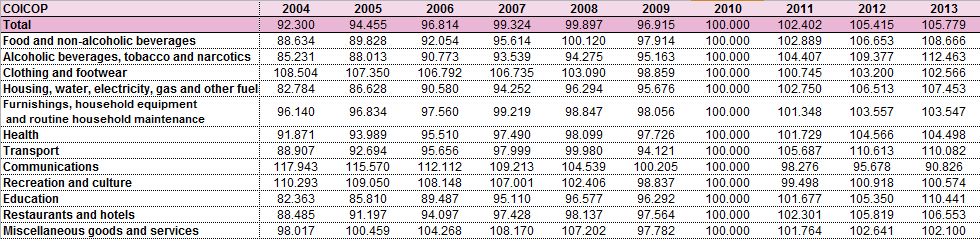
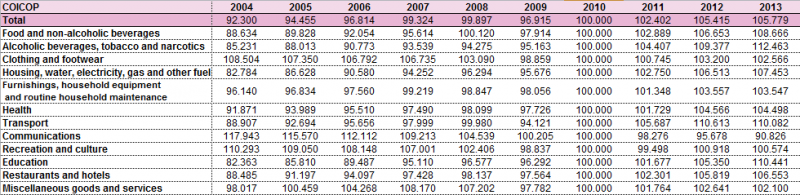
File:Table 4- Evolution of implicit deflator, 2010=100 of household expenditure by consumption purpose – COICOP, EU-28, 2004-2013 – Source- Eurostat (nama 10 co3 p3).png
Size of this preview: 800 × 195 pixels. Other resolution: 980 × 239 pixels.
Original file (980 × 239 pixels, file size: 21 KB, MIME type: image/png)
Table 4: Evolution of implicit deflator, 2010=100 of household expenditure by consumption purpose – COICOP, EU-28, 2004-2013 – Source: Eurostat (nama_10_co3_p3)
File usage
There are no pages that use this file.
.png&oldid=288195)
.png)
.png&action=edit&redlink=1)
.png&action=history)