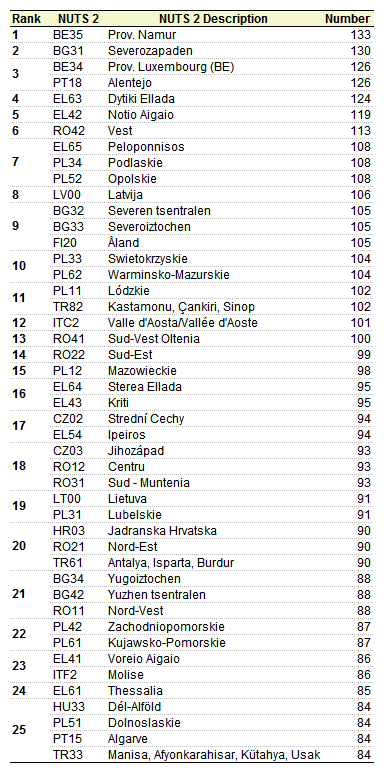
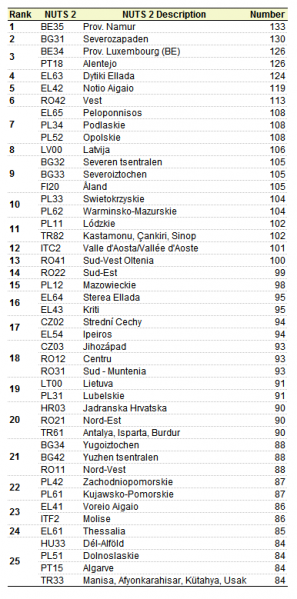
File:Table 2 Ranking of the 25 NUTS 2 regions which have the highest number of road fatalities per million inhabitants in 2014.png
Size of this preview: 297 × 599 pixels. Other resolutions: 119 × 240 pixels | 386 × 779 pixels.
Original file (386 × 779 pixels, file size: 26 KB, MIME type: image/png)
File usage
There are no pages that use this file.