.png)
.png&body=Statistics Explained - Table 1 - The all-items HICP and HICPs for cultural goods and services, annual average rates of change 2018-2023 and 2022-2023 (%).png %0A https%3A%2F%2Fec.europa.eu%2Feurostat%2Fstatistics-explained%2Findex.php%3Ftitle%3DFile%3ATable_1_-_The_all-items_HICP_and_HICPs_for_cultural_goods_and_services%2C_annual_average_rates_of_change_2018-2023_and_2022-2023_%28%2525%29.png)
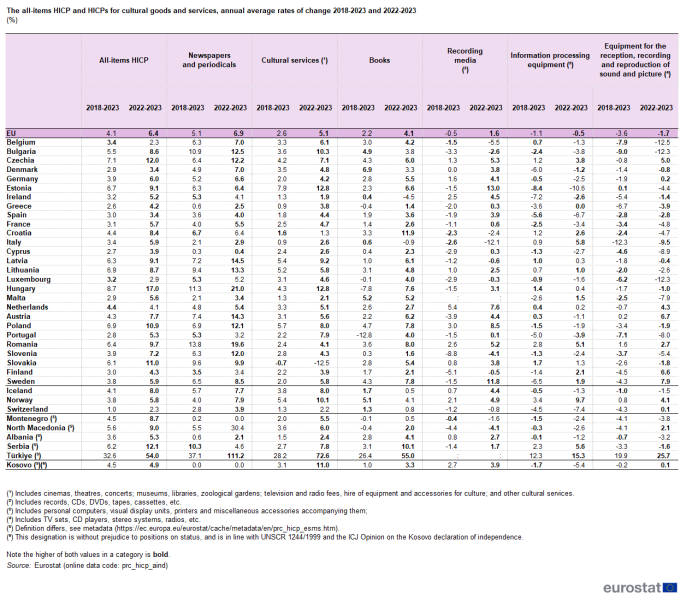
File:Table 1 - The all-items HICP and HICPs for cultural goods and services, annual average rates of change 2018-2023 and 2022-2023 (%).png

Size of this preview: 686 × 599 pixels. Other resolutions: 275 × 240 pixels | 1,256 × 1,097 pixels.
Original file (1,256 × 1,097 pixels, file size: 108 KB, MIME type: image/png)
null
File usage
The following page uses this file:
.png&oldid=632931)
.png)
.png&action=edit&redlink=1)
.png&action=history)