.png)
.png&body=Statistics Explained - Table2 Proportion of population aged 65 years and more by urban-rural typology, 2019 and 2050 (%).png %0A https%3A%2F%2Fec.europa.eu%2Feurostat%2Fstatistics-explained%2Findex.php%3Ftitle%3DFile%3ATable2_Proportion_of_population_aged_65_years_and_more_by_urban-rural_typology%2C_2019_and_2050_%28%2525%29.png)
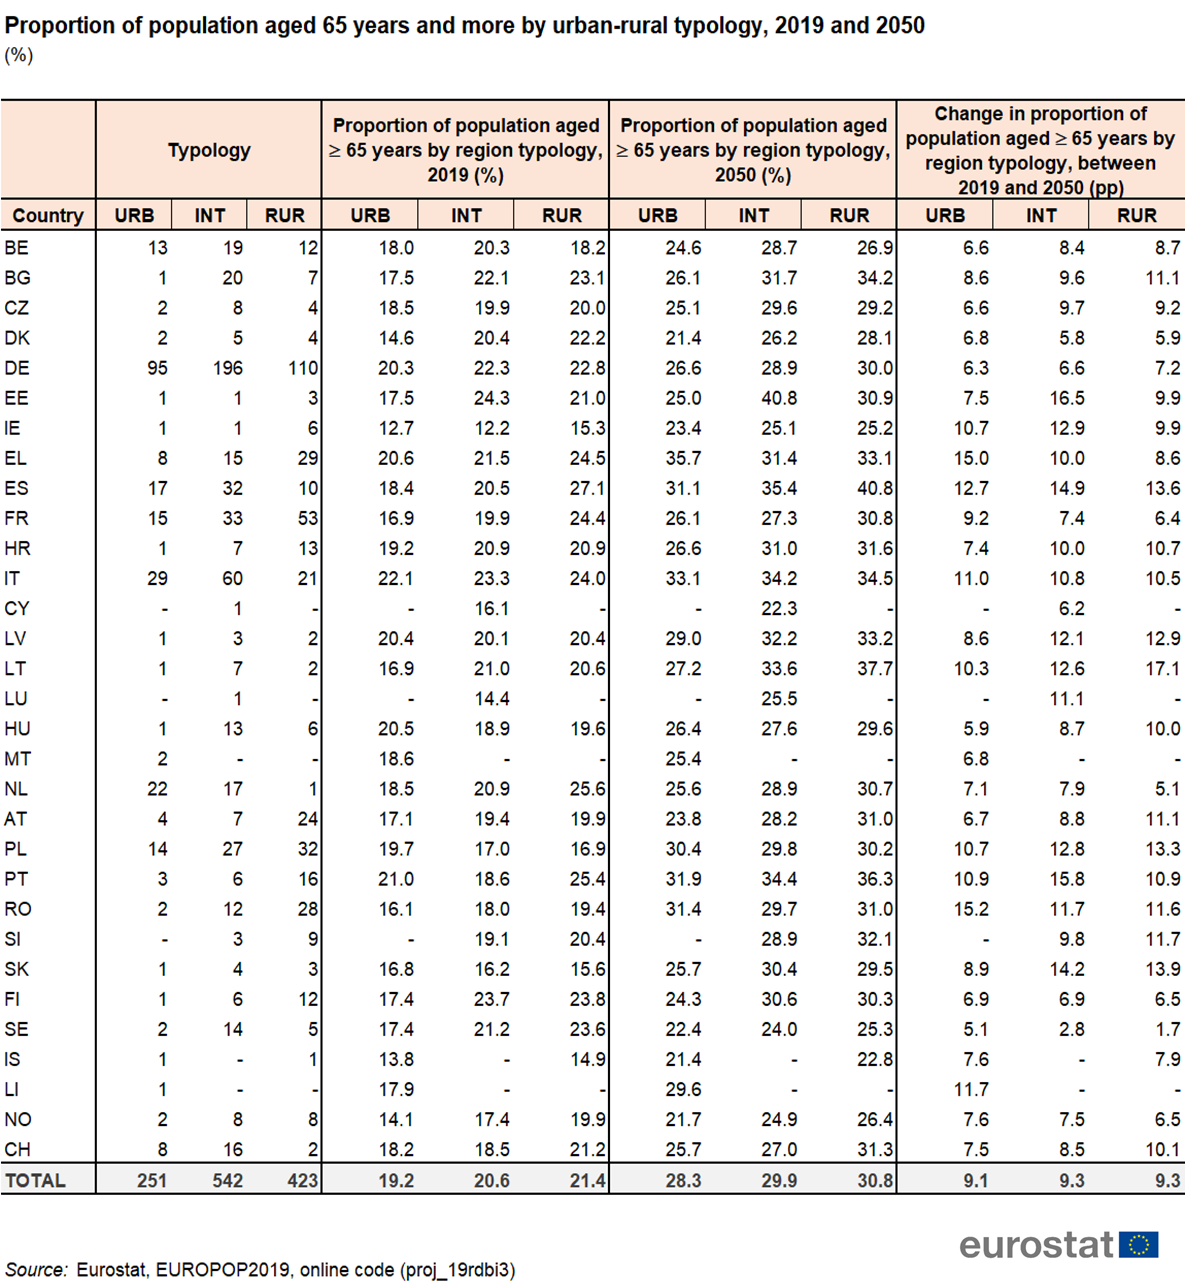
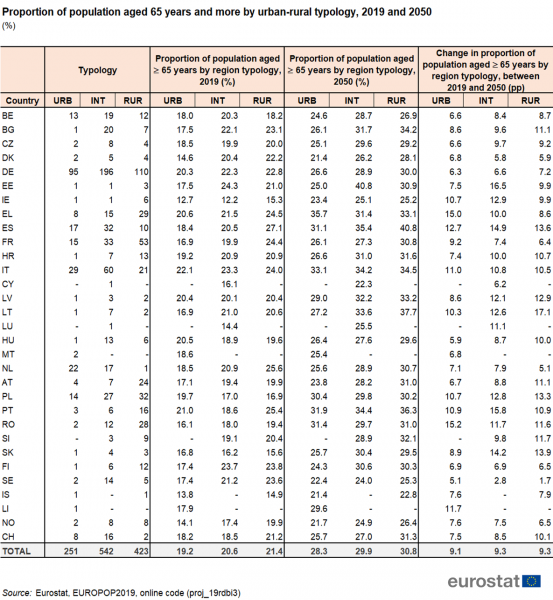
File:Table2 Proportion of population aged 65 years and more by urban-rural typology, 2019 and 2050 (%).png
Size of this preview: 553 × 600 pixels. Other resolutions: 221 × 240 pixels | 1,185 × 1,285 pixels.
Original file (1,185 × 1,285 pixels, file size: 556 KB, MIME type: image/png)
File usage
The following file is a duplicate of this file (more details):
.png)
_.png)
There are no pages that use this file.
.png&oldid=522041)
.png)
.png&action=edit&redlink=1)
.png&action=history)