.PNG)
.PNG&body=Statistics Explained - Structure of the food chain, selected indicators, EU-27, 2008 (%).PNG %0A https%3A%2F%2Fec.europa.eu%2Feurostat%2Fstatistics-explained%2Findex.php%3Ftitle%3DFile%3AStructure_of_the_food_chain%2C_selected_indicators%2C_EU-27%2C_2008_%28%2525%29.PNG)
File:Structure of the food chain, selected indicators, EU-27, 2008 (%).PNG
Size of this preview: 799 × 299 pixels. Other resolutions: 320 × 120 pixels | 823 × 308 pixels.
Original file (823 × 308 pixels, file size: 27 KB, MIME type: image/png)
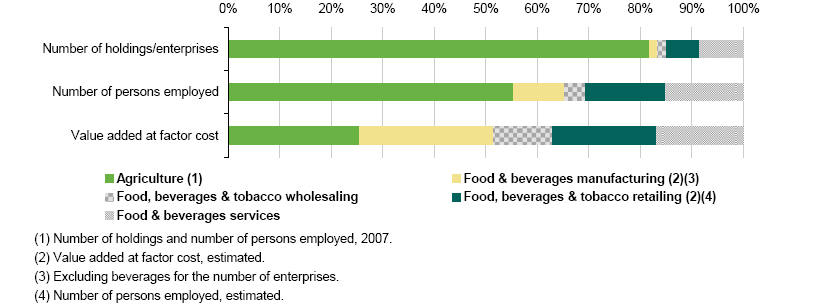
Structure of the food chain, selected indicators, EU-27, 2008
- (%)
Figure created with data from March 2011
Most recent data available now, see:
Key variables by type of farming (2-digit) and economic size of farm (ESU) (ef_ov_kvftesu)
Economic accounts for agriculture - values at current prices (aact_eaa01)
Annual detailed enterprise statistics for industry (NACE Rev.2 B-E) (sbs_na_ind_r2)
Annual detailed enterprise statistics for trade (NACE Rev.2 G) (sbs_na_dt_r2)
Annual detailed enterprise statistics for services (NACE Rev.2 H-N and S95) (sbs_na_1a_se_r2)
File usage
The following page uses this file:
.PNG&oldid=60264)
.PNG)
.PNG&action=edit&redlink=1)
.PNG&action=history)