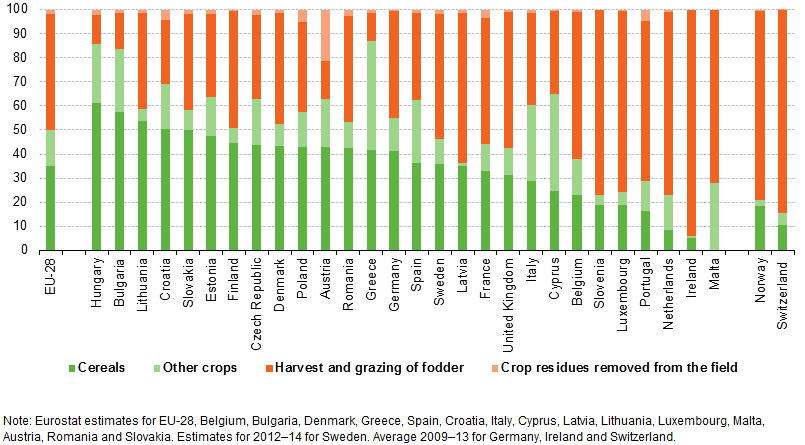
File:Share of the different nitrogen outputs in total nitrogen outputs, average 2009–14.png
Size of this preview: 800 × 442 pixels. Other resolutions: 320 × 177 pixels | 805 × 445 pixels.
Original file (805 × 445 pixels, file size: 43 KB, MIME type: image/png)
File usage
The following page uses this file: