.png)
.png&body=Statistics Explained - Share of the different nitrogen outputs in total nitrogen outputs, average 2009–14(%).png %0A https%3A%2F%2Fec.europa.eu%2Feurostat%2Fstatistics-explained%2Findex.php%3Ftitle%3DFile%3AShare_of_the_different_nitrogen_outputs_in_total_nitrogen_outputs%2C_average_2009%25E2%2580%259314%28%2525%29.png)
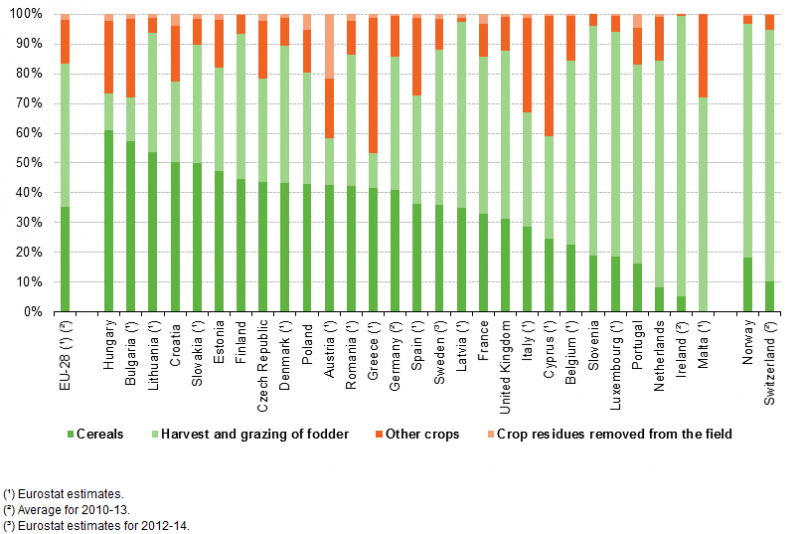
File:Share of the different nitrogen outputs in total nitrogen outputs, average 2009–14(%).png

Size of this preview: 800 × 534 pixels. Other resolutions: 320 × 213 pixels | 805 × 537 pixels.
Original file (805 × 537 pixels, file size: 29 KB, MIME type: image/png)
File usage
There are no pages that use this file.
.png&oldid=310873)
.png)
.png&action=edit&redlink=1)
.png&action=history)