.PNG)
.PNG&body=Statistics Explained - Share of imports in the total use of selected products, EU27 2006 (in %).PNG %0A https%3A%2F%2Fec.europa.eu%2Feurostat%2Fstatistics-explained%2Findex.php%3Ftitle%3DFile%3AShare_of_imports_in_the_total_use_of_selected_products%2C_EU27_2006_%28in_%2525%29.PNG)
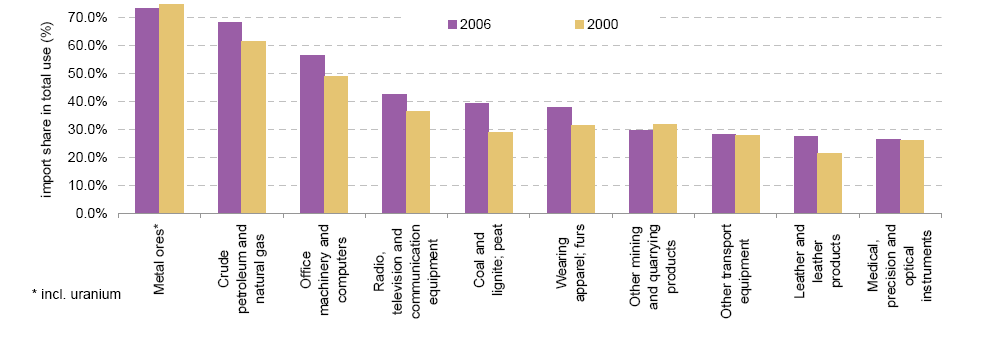
File:Share of imports in the total use of selected products, EU27 2006 (in %).PNG
Size of this preview: 800 × 283 pixels. Other resolutions: 320 × 113 pixels | 982 × 347 pixels.
Original file (982 × 347 pixels, file size: 28 KB, MIME type: image/png)
- (in %)
Figure created with data from April 2011
Most recent data available now, see:
Supply table at current prices, 60 branches - EU aggregates (naio_15_agg_60)
File usage
The following page uses this file:
.PNG&oldid=62437)
.PNG)
.PNG&action=edit&redlink=1)
.PNG&action=history)