,_2005_and_2015_(%25_of_total_gross_value_added)_CPC16.png)
, 2005 and 2015 (% of total gross value added) CPC16.png&body=Statistics Explained - Share of gross value added from agriculture, forestry and fishing (NACE Rev 2), 2005 and 2015 (% of total gross value added) CPC16.png %0A https%3A%2F%2Fec.europa.eu%2Feurostat%2Fstatistics-explained%2Findex.php%3Ftitle%3DFile%3AShare_of_gross_value_added_from_agriculture%2C_forestry_and_fishing_%28NACE_Rev_2%29%2C_2005_and_2015_%28%2525_of_total_gross_value_added%29_CPC16.png)
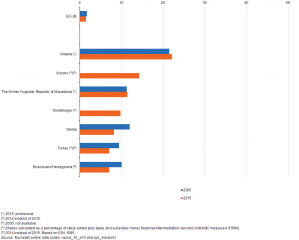
File:Share of gross value added from agriculture, forestry and fishing (NACE Rev 2), 2005 and 2015 (% of total gross value added) CPC16.png

Size of this preview: 746 × 600 pixels. Other resolutions: 299 × 240 pixels | 1,005 × 808 pixels.
Original file (1,005 × 808 pixels, file size: 26 KB, MIME type: image/png)
File usage
There are no pages that use this file.
,_2005_and_2015_(%25_of_total_gross_value_added)_CPC16.png&oldid=308392)
,_2005_and_2015_(%25_of_total_gross_value_added)_CPC16.png)
,_2005_and_2015_(%25_of_total_gross_value_added)_CPC16.png&action=edit&redlink=1)
,_2005_and_2015_(%25_of_total_gross_value_added)_CPC16.png&action=history)