,_2020_(age_group_55-64,_in_%25_of_employed_people).png)
, 2020 (age group 55-64, in % of employed people).png&body=Statistics Explained - Share of employed people and not employed people by occupational category (current or last job), 2020 (age group 55-64, in % of employed people).png %0A https%3A%2F%2Fec.europa.eu%2Feurostat%2Fstatistics-explained%2Findex.php%3Ftitle%3DFile%3AShare_of_employed_people_and_not_employed_people_by_occupational_category_%28current_or_last_job%29%2C_2020_%28age_group_55-64%2C_in_%2525_of_employed_people%29.png)
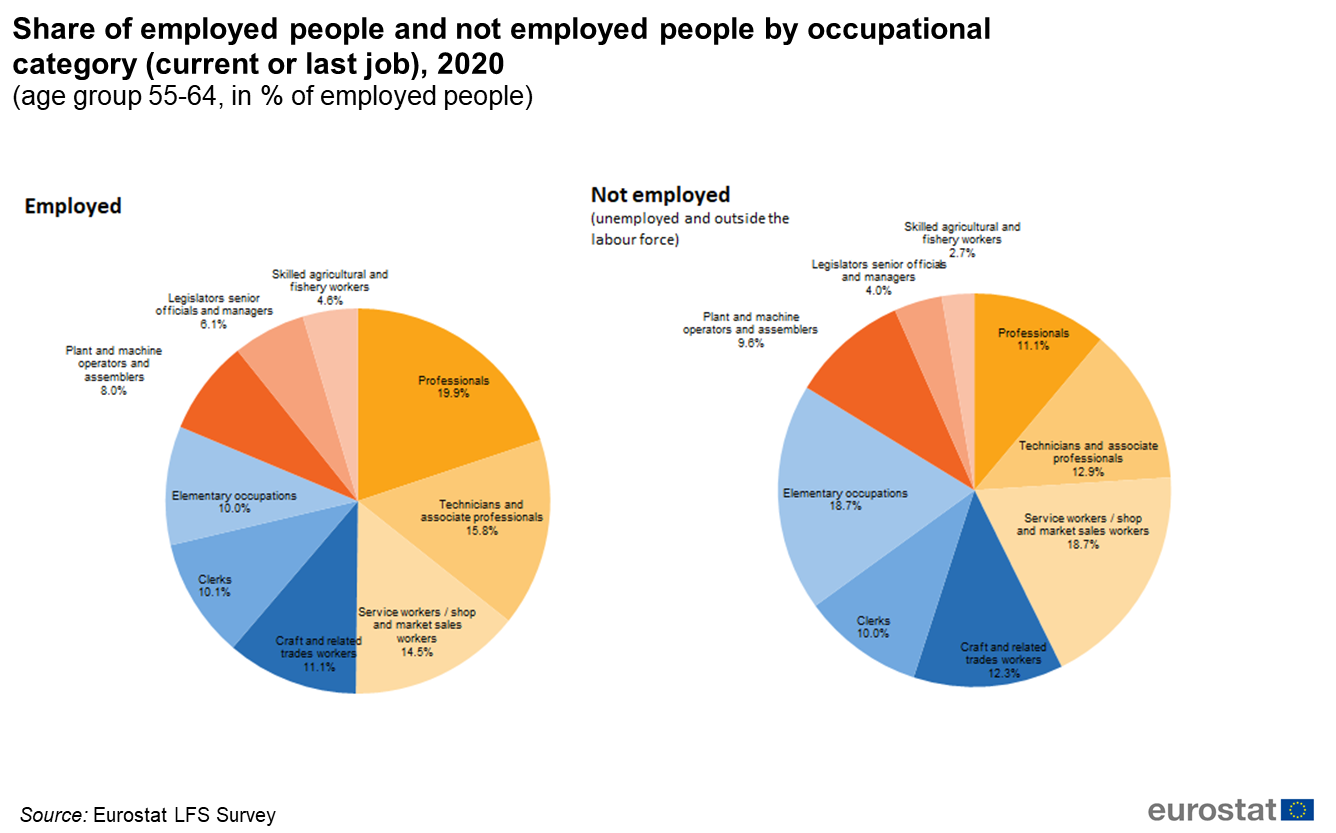
File:Share of employed people and not employed people by occupational category (current or last job), 2020 (age group 55-64, in % of employed people).png
Size of this preview: 800 × 499 pixels. Other resolutions: 320 × 200 pixels | 1,336 × 833 pixels.
Original file (1,336 × 833 pixels, file size: 256 KB, MIME type: image/png)
File usage
There are no pages that use this file.
,_2020_(age_group_55-64,_in_%25_of_employed_people).png&oldid=535351)
,_2020_(age_group_55-64,_in_%25_of_employed_people).png)
,_2020_(age_group_55-64,_in_%25_of_employed_people).png&action=edit&redlink=1)
,_2020_(age_group_55-64,_in_%25_of_employed_people).png&action=history)