_.png)
 .png&body=Statistics Explained - Share of agriculture to total ammonia emissions, EU-28, 2011, (%) .png %0A https%3A%2F%2Fec.europa.eu%2Feurostat%2Fstatistics-explained%2Findex.php%3Ftitle%3DFile%3AShare_of_agriculture_to_total_ammonia_emissions%2C_EU-28%2C_2011%2C_%28%2525%29_.png)
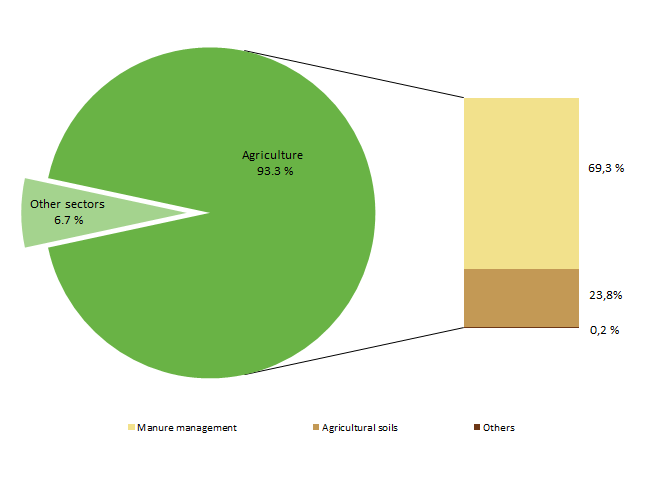
File:Share of agriculture to total ammonia emissions, EU-28, 2011, (%) .png
No higher resolution available.
Share_of_agriculture_to_total_ammonia_emissions,_EU-28,_2011,_(%)_.png (649 × 496 pixels, file size: 11 KB, MIME type: image/png)
Graph created with data from 2011.
Data extracted in July 2013. Most recent data available at:
http://www.eea.europa.eu/data-and-maps/data/data-viewers/air-emissions-viewer-lrtap
File usage
There are no pages that use this file.
_.png&oldid=145290)
_.png)
_.png&action=edit&redlink=1)
_.png&action=history)