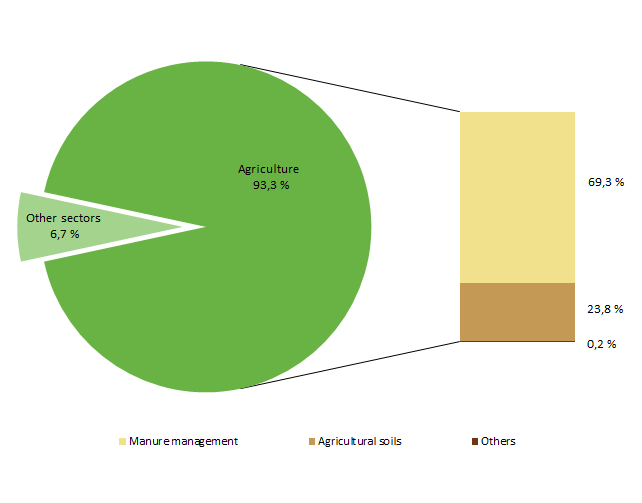
File:Share of agriculture to total ammonia emissions, EU-28, 2011, (%).png
Share_of_agriculture_to_total_ammonia_emissions,_EU-28,_2011,_(%).png (642 × 503 pixels, file size: 11 KB, MIME type: image/png)
Graph created with data from 2011.
Data extracted in July 2013. Most recent data available at:
http://www.eea.europa.eu/data-and-maps/data/data-viewers/air-emissions-viewer-lrtap
File usage
There are no pages that use this file.
