_(%25_of_total_value_added)-de.png)
 (% of total value added)-de.png&body=Statistics Explained - Share of agriculture in the economy, gross value added at basic prices, by NUTS 2 regions, 2009 (1) (% of total value added)-de.png %0A https%3A%2F%2Fec.europa.eu%2Feurostat%2Fstatistics-explained%2Findex.php%3Ftitle%3DFile%3AShare_of_agriculture_in_the_economy%2C_gross_value_added_at_basic_prices%2C_by_NUTS_2_regions%2C_2009_%281%29_%28%2525_of_total_value_added%29-de.png)
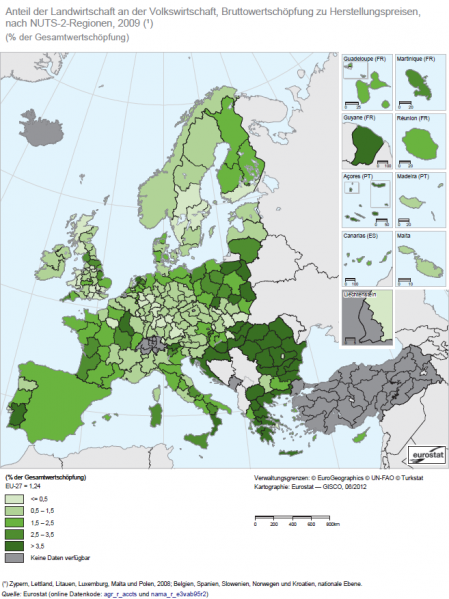
File:Share of agriculture in the economy, gross value added at basic prices, by NUTS 2 regions, 2009 (1) (% of total value added)-de.png

Size of this preview: 449 × 599 pixels. Other resolutions: 180 × 240 pixels | 657 × 877 pixels.
Original file (657 × 877 pixels, file size: 157 KB, MIME type: image/png)
File usage
There are no pages that use this file.
_(%25_of_total_value_added)-de.png&oldid=107451)
_(%25_of_total_value_added)-de.png)
_(%25_of_total_value_added)-de.png&action=edit&redlink=1)
_(%25_of_total_value_added)-de.png&action=history)