.PNG)
.PNG&body=Statistics Explained - Range and average of selected ageing indicators on 1 January 2010 (average each indicator =100).PNG %0A https%3A%2F%2Fec.europa.eu%2Feurostat%2Fstatistics-explained%2Findex.php%3Ftitle%3DFile%3ARange_and_average_of_selected_ageing_indicators_on_1_January_2010_%28average_each_indicator_%253D100%29.PNG)
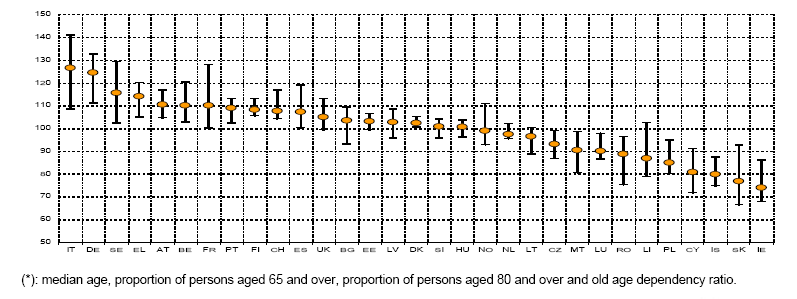
File:Range and average of selected ageing indicators on 1 January 2010 (average each indicator =100).PNG
No higher resolution available.
Range_and_average_of_selected_ageing_indicators_on_1_January_2010_(average_each_indicator_=100).PNG (797 × 299 pixels, file size: 24 KB, MIME type: image/png)
Range and average of selected ageing indicators on 1 January 2010 (average each indicator =100)
- (average each indicator =100)
Figure created with data from April 2011
File usage
The following page uses this file:
.PNG&oldid=59513)
.PNG)
.PNG&action=edit&redlink=1)
.PNG&action=history)