,_2000-2006,_EU-27,_NUTS_0.png)
, 2000-2006, EU-27, NUTS 0.png&body=Statistics Explained - Quality of lost cropland relative to the countries’ average cropland productivity (1 = average crop productivity of the country), 2000-2006, EU-27, NUTS 0.png %0A https%3A%2F%2Fec.europa.eu%2Feurostat%2Fstatistics-explained%2Findex.php%3Ftitle%3DFile%3AQuality_of_lost_cropland_relative_to_the_countries%25E2%2580%2599_average_cropland_productivity_%281_%253D_average_crop_productivity_of_the_country%29%2C_2000-2006%2C_EU-27%2C_NUTS_0.png)
File:Quality of lost cropland relative to the countries’ average cropland productivity (1 = average crop productivity of the country), 2000-2006, EU-27, NUTS 0.png

Size of this preview: 505 × 600 pixels. Other resolutions: 202 × 240 pixels | 2,486 × 2,953 pixels.
Original file (2,486 × 2,953 pixels, file size: 1.5 MB, MIME type: image/png)
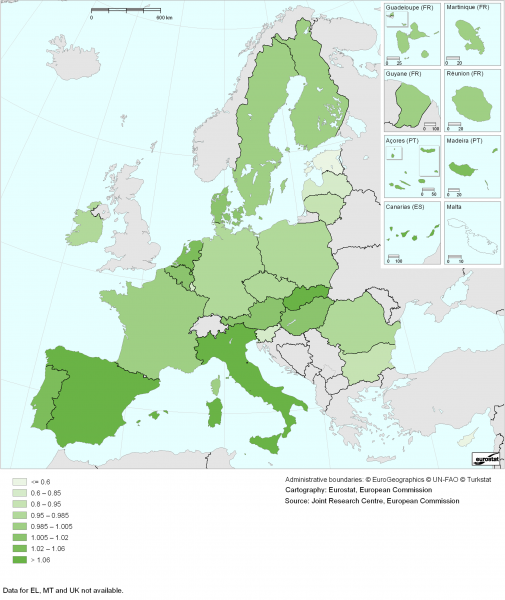
Quality of lost cropland relative to the countries’ average cropland productivity (1 = average crop productivity of the country), 2000-2006, EU-27, NUTS 0.
Graph created with data from 2000 and 2006
Data extracted in July 2012. Most recent data available at:
Joint Research Centre, European Commission
File usage
The following page uses this file:
,_2000-2006,_EU-27,_NUTS_0.png&oldid=134455)
,_2000-2006,_EU-27,_NUTS_0.png)
,_2000-2006,_EU-27,_NUTS_0.png&action=edit&redlink=1)
,_2000-2006,_EU-27,_NUTS_0.png&action=history)