_(%25_of_total_population)-fr.png)
 (% of total population)-fr.png&body=Statistics Explained - Population structure by major age groups, EU-27, 1990-2060 (1) (% of total population)-fr.png %0A https%3A%2F%2Fec.europa.eu%2Feurostat%2Fstatistics-explained%2Findex.php%3Ftitle%3DFile%3APopulation_structure_by_major_age_groups%2C_EU-27%2C_1990-2060_%281%29_%28%2525_of_total_population%29-fr.png)
File:Population structure by major age groups, EU-27, 1990-2060 (1) (% of total population)-fr.png
No higher resolution available.
Population_structure_by_major_age_groups,_EU-27,_1990-2060_(1)_(%_of_total_population)-fr.png (573 × 290 pixels, file size: 11 KB, MIME type: image/png)
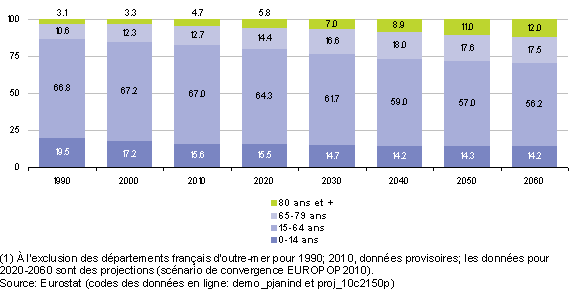
Graphique 6: Structure de la population, par grande tranche d’âge, UE-27, 1990-2060 (1)
(en % de la population totale) - Source: Eurostat (demo_pjanind)and (proj_10c2150p)
File usage
There are no pages that use this file.
_(%25_of_total_population)-fr.png&oldid=92419)
_(%25_of_total_population)-fr.png)
_(%25_of_total_population)-fr.png&action=edit&redlink=1)
_(%25_of_total_population)-fr.png&action=history)