,_EU-27,_1960-2010_(1)_(per_1_000_inhabitants)-fr.png)
, EU-27, 1960-2010 (1) (per 1 000 inhabitants)-fr.png&body=Statistics Explained - Population change by component (annual crude rates), EU-27, 1960-2010 (1) (per 1 000 inhabitants)-fr.png %0A https%3A%2F%2Fec.europa.eu%2Feurostat%2Fstatistics-explained%2Findex.php%3Ftitle%3DFile%3APopulation_change_by_component_%28annual_crude_rates%29%2C_EU-27%2C_1960-2010_%281%29_%28per_1_000_inhabitants%29-fr.png)
File:Population change by component (annual crude rates), EU-27, 1960-2010 (1) (per 1 000 inhabitants)-fr.png
No higher resolution available.
Population_change_by_component_(annual_crude_rates),_EU-27,_1960-2010_(1)_(per_1_000_inhabitants)-fr.png (573 × 250 pixels, file size: 8 KB, MIME type: image/png)
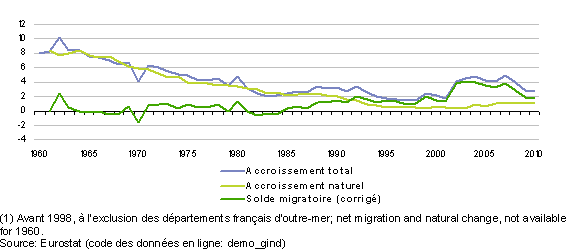
Graphique 2: Accroissement de la population par composante (taux bruts annuels), UE-27, 1960-2010 (1)
(pour 1 000 habitants) - Source: Eurostat (demo_gind)
File usage
There are no pages that use this file.
,_EU-27,_1960-2010_(1)_(per_1_000_inhabitants)-fr.png&oldid=92696)
,_EU-27,_1960-2010_(1)_(per_1_000_inhabitants)-fr.png)
,_EU-27,_1960-2010_(1)_(per_1_000_inhabitants)-fr.png&action=edit&redlink=1)
,_EU-27,_1960-2010_(1)_(per_1_000_inhabitants)-fr.png&action=history)