.png)
.png&body=Statistics Explained - Phosphorus Use Efficiency, average 2003–08 vs 2009–14 (total nutrient outputs per total nutrient inputs).png %0A https%3A%2F%2Fec.europa.eu%2Feurostat%2Fstatistics-explained%2Findex.php%3Ftitle%3DFile%3APhosphorus_Use_Efficiency%2C_average_2003%25E2%2580%259308_vs_2009%25E2%2580%259314_%28total_nutrient_outputs_per_total_nutrient_inputs%29.png)
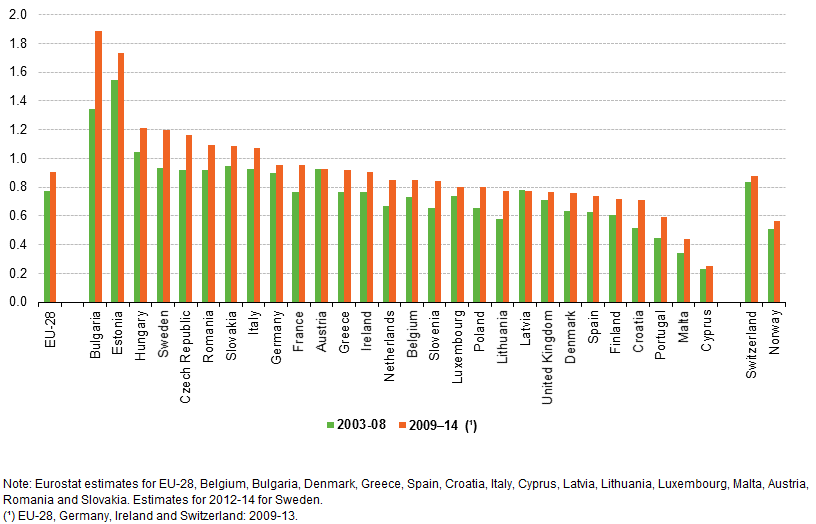
File:Phosphorus Use Efficiency, average 2003–08 vs 2009–14 (total nutrient outputs per total nutrient inputs).png
Size of this preview: 800 × 514 pixels. Other resolutions: 320 × 205 pixels | 816 × 524 pixels.
Original file (816 × 524 pixels, file size: 24 KB, MIME type: image/png)
File usage
The following page uses this file:
.png&oldid=314269)
.png)
.png&action=edit&redlink=1)
.png&action=history)