.png)
.png&body=Statistics Explained - Non-financial corporations, investment rate and annual rate of change in gross fixed capital formation and value added, EU 27 (%).png %0A https%3A%2F%2Fec.europa.eu%2Feurostat%2Fstatistics-explained%2Findex.php%3Ftitle%3DFile%3ANon-financial_corporations%2C_investment_rate_and_annual_rate_of_change_in_gross_fixed_capital_formation_and_value_added%2C_EU_27_%28%2525%29.png)
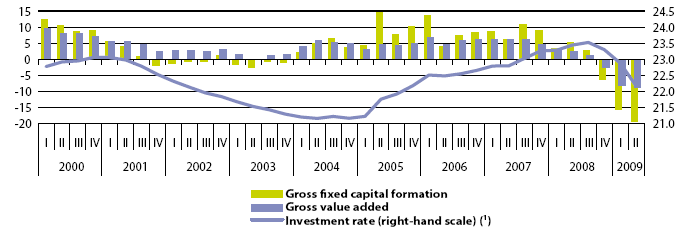
File:Non-financial corporations, investment rate and annual rate of change in gross fixed capital formation and value added, EU 27 (%).png
No higher resolution available.
Non-financial_corporations,_investment_rate_and_annual_rate_of_change_in_gross_fixed_capital_formation_and_value_added,_EU_27_(%).png (693 × 234 pixels, file size: 10 KB, MIME type: image/png)
There is currently no text in this page. You can search for this page title in other pages, search the related logs, or create this page.
.png)
File usage
The following page uses this file:
.png&oldid=45694)
.png)
.png&action=edit&redlink=1)
.png&action=history)