.png)
.png&body=Statistics Explained - Nitrogen use efficiency, average 2000–04 and 2010–14 (total N outputs devided by total N inputs).png %0A https%3A%2F%2Fec.europa.eu%2Feurostat%2Fstatistics-explained%2Findex.php%3Ftitle%3DFile%3ANitrogen_use_efficiency%2C_average_2000%25E2%2580%259304_and_2010%25E2%2580%259314_%28total_N_outputs_devided_by_total_N_inputs%29.png)
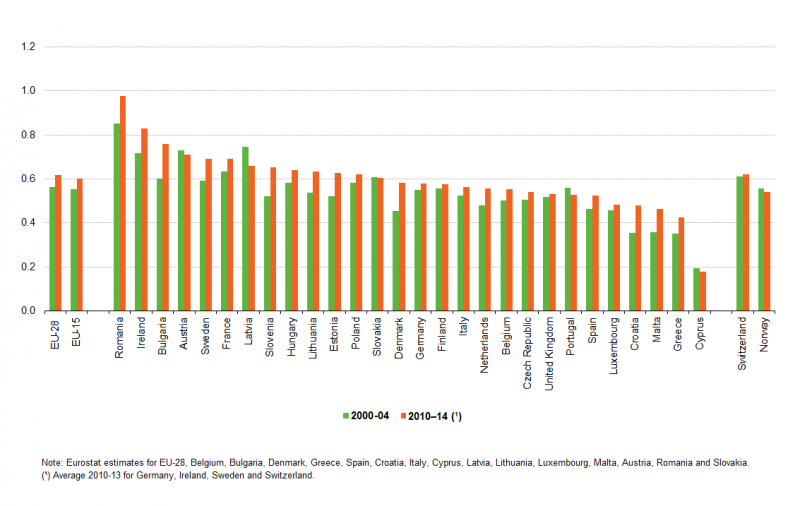
File:Nitrogen use efficiency, average 2000–04 and 2010–14 (total N outputs devided by total N inputs).png

Size of this preview: 800 × 506 pixels. Other resolutions: 320 × 203 pixels | 1,133 × 717 pixels.
Original file (1,133 × 717 pixels, file size: 56 KB, MIME type: image/png)
File usage
There are no pages that use this file.
.png&oldid=327200)
.png)
.png&action=edit&redlink=1)
.png&action=history)