,_by_NUTS_3_regions,_2008-de.PNG)
, by NUTS 3 regions, 2008-de.PNG&body=Statistics Explained - Net migration (including statistical adjustment), by NUTS 3 regions, 2008-de.PNG %0A https%3A%2F%2Fec.europa.eu%2Feurostat%2Fstatistics-explained%2Findex.php%3Ftitle%3DFile%3ANet_migration_%28including_statistical_adjustment%29%2C_by_NUTS_3_regions%2C_2008-de.PNG)
File:Net migration (including statistical adjustment), by NUTS 3 regions, 2008-de.PNG
Size of this preview: 585 × 600 pixels. Other resolutions: 234 × 240 pixels | 1,215 × 1,246 pixels.
Original file (1,215 × 1,246 pixels, file size: 429 KB, MIME type: image/png)
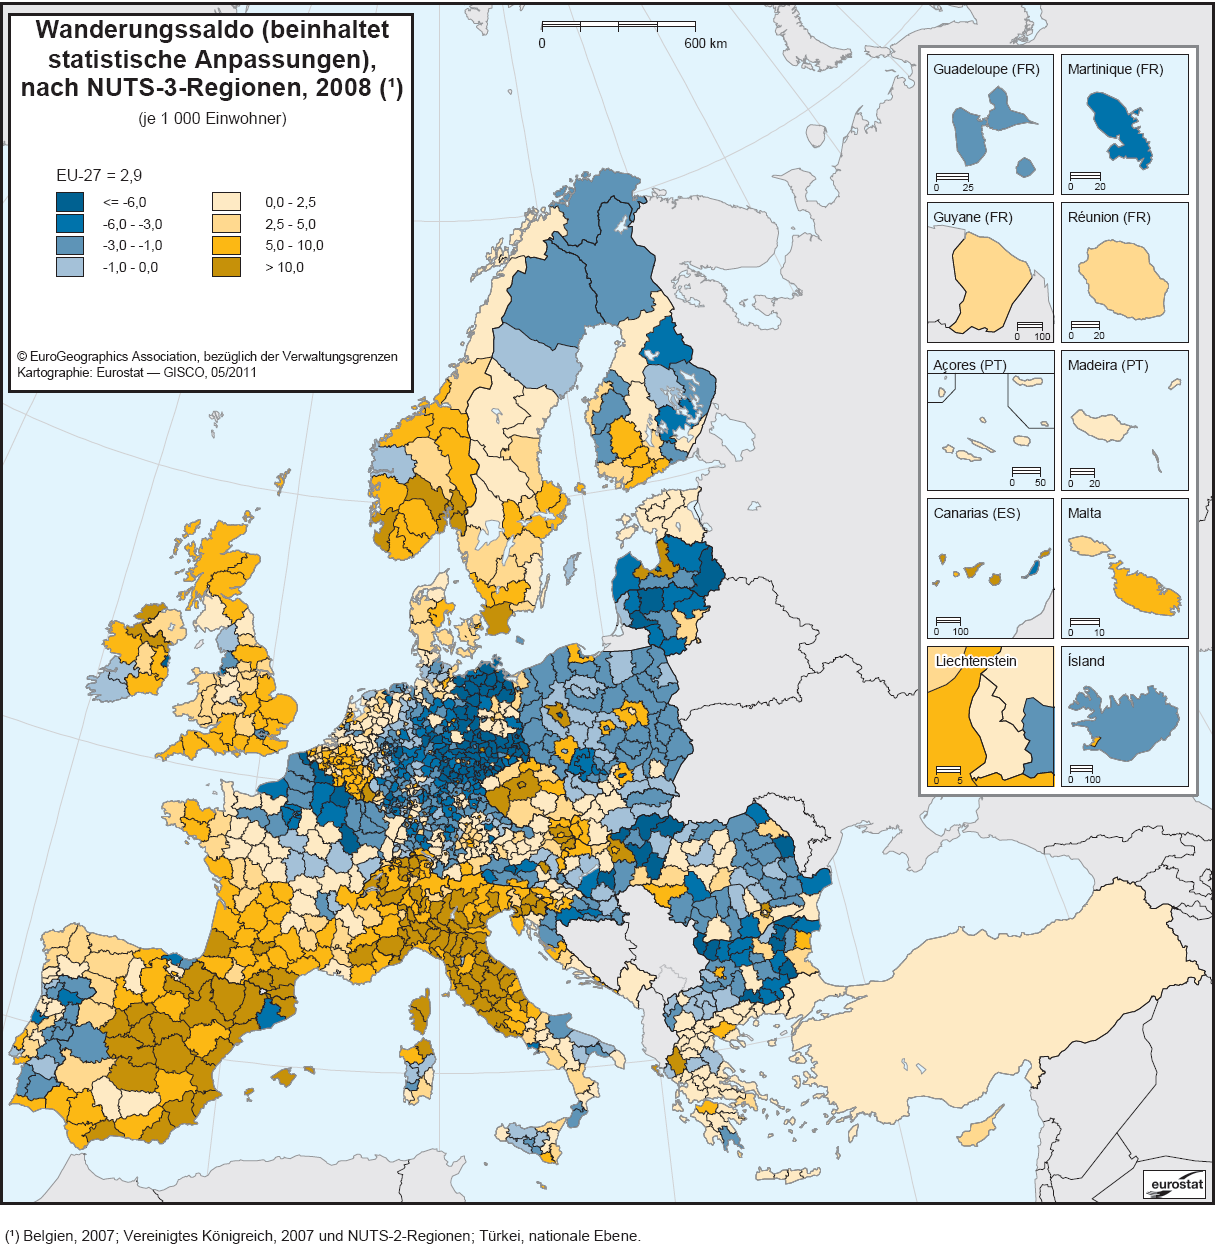
Karte 4: Wanderungssaldo (beinhaltet statistische Anpassungen), nach NUTS-3-Regionen, 2008 (je 1 000 Einwohner) - Quelle: Eurostat (online Datenkode: demo_r_gind3 und demo_gind)
File usage
The following page uses this file:
,_by_NUTS_3_regions,_2008-de.PNG&oldid=77409)
,_by_NUTS_3_regions,_2008-de.PNG)
,_by_NUTS_3_regions,_2008-de.PNG&action=edit&redlink=1)
,_by_NUTS_3_regions,_2008-de.PNG&action=history)