,_by_NUTS_2_regions,_average_2003%E2%80%9307_Per_1_000_inhabitants.PNG)
, by NUTS 2 regions, average 2003–07 Per 1 000 inhabitants.PNG&body=Statistics Explained - Natural population change (live births minus deaths), by NUTS 2 regions, average 2003–07 Per 1 000 inhabitants.PNG %0A https%3A%2F%2Fec.europa.eu%2Feurostat%2Fstatistics-explained%2Findex.php%3Ftitle%3DFile%3ANatural_population_change_%28live_births_minus_deaths%29%2C_by_NUTS_2_regions%2C_average_2003%25E2%2580%259307_Per_1_000_inhabitants.PNG)
File:Natural population change (live births minus deaths), by NUTS 2 regions, average 2003–07 Per 1 000 inhabitants.PNG
Size of this preview: 621 × 599 pixels. Other resolutions: 249 × 240 pixels | 711 × 686 pixels.
Original file (711 × 686 pixels, file size: 209 KB, MIME type: image/png)
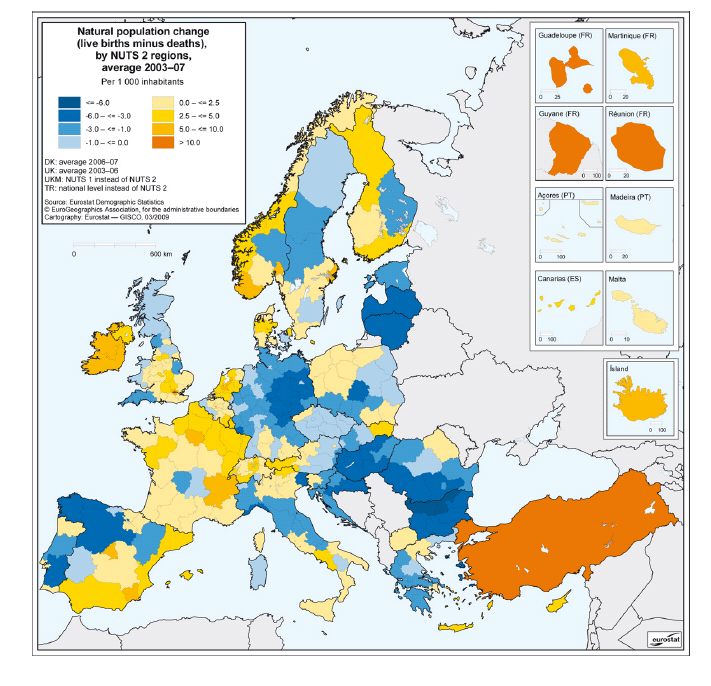
Natural population change (live births minus deaths), by NUTS 2 regions, average 2003–07
- Per 1 000 inhabitants
Map created with data from March 2009
Most recent data available now, see:
File usage
There are no pages that use this file.
,_by_NUTS_2_regions,_average_2003–07_Per_1_000_inhabitants.PNG&oldid=14685)
,_by_NUTS_2_regions,_average_2003%E2%80%9307_Per_1_000_inhabitants.PNG)
,_by_NUTS_2_regions,_average_2003%E2%80%9307_Per_1_000_inhabitants.PNG&action=edit&redlink=1)
,_by_NUTS_2_regions,_average_2003%E2%80%9307_Per_1_000_inhabitants.PNG&action=history)