File:Natural population change, by NUTS 3 regions, 2008-de.PNG

Size of this preview: 586 × 600 pixels. Other resolutions: 234 × 240 pixels | 1,216 × 1,245 pixels.
Original file (1,216 × 1,245 pixels, file size: 421 KB, MIME type: image/png)
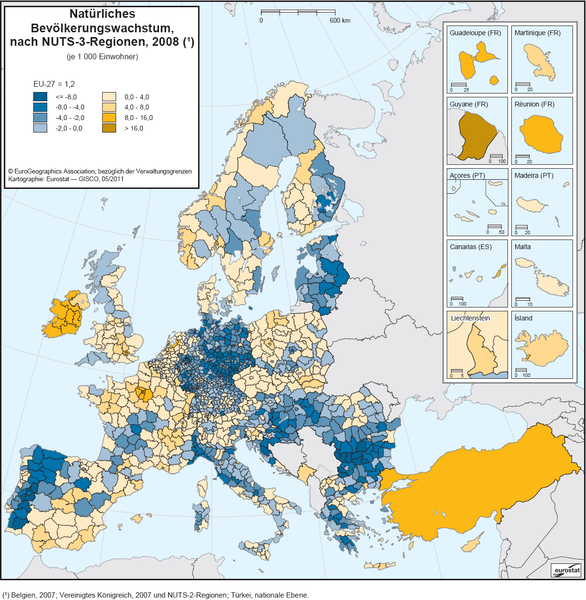
Karte 3: Natürliches Bevölkerungswachstum, nach NUTS-3-Regionen, 2008 (je 1 000 Einwohner) - Quelle: Eurostat (online Datenkode: demo_r_gind3 und demo_gind)
File usage
The following page uses this file: