_(number_of_passenger_cars_per_1_000_inhabitants_in_2013,_%25_overall_change_in_motorisation_rate_from_2008%E2%80%9313)_RYB15.png)
 (number of passenger cars per 1 000 inhabitants in 2013, % overall change in motorisation rate from 2008–13) RYB15.png&body=Statistics Explained - Motorisation rate and changes in motorisation rate, by NUTS level 2 region, 2008–13 (¹) (number of passenger cars per 1 000 inhabitants in 2013, % overall change in motorisation rate from 2008–13) RYB15.png %0A https%3A%2F%2Fec.europa.eu%2Feurostat%2Fstatistics-explained%2Findex.php%3Ftitle%3DFile%3AMotorisation_rate_and_changes_in_motorisation_rate%2C_by_NUTS_level_2_region%2C_2008%25E2%2580%259313_%28%25C2%25B9%29_%28number_of_passenger_cars_per_1_000_inhabitants_in_2013%2C_%2525_overall_change_in_motorisation_rate_from_2008%25E2%2580%259313%29_RYB15.png)
File:Motorisation rate and changes in motorisation rate, by NUTS level 2 region, 2008–13 (¹) (number of passenger cars per 1 000 inhabitants in 2013, % overall change in motorisation rate from 2008–13) RYB15.png
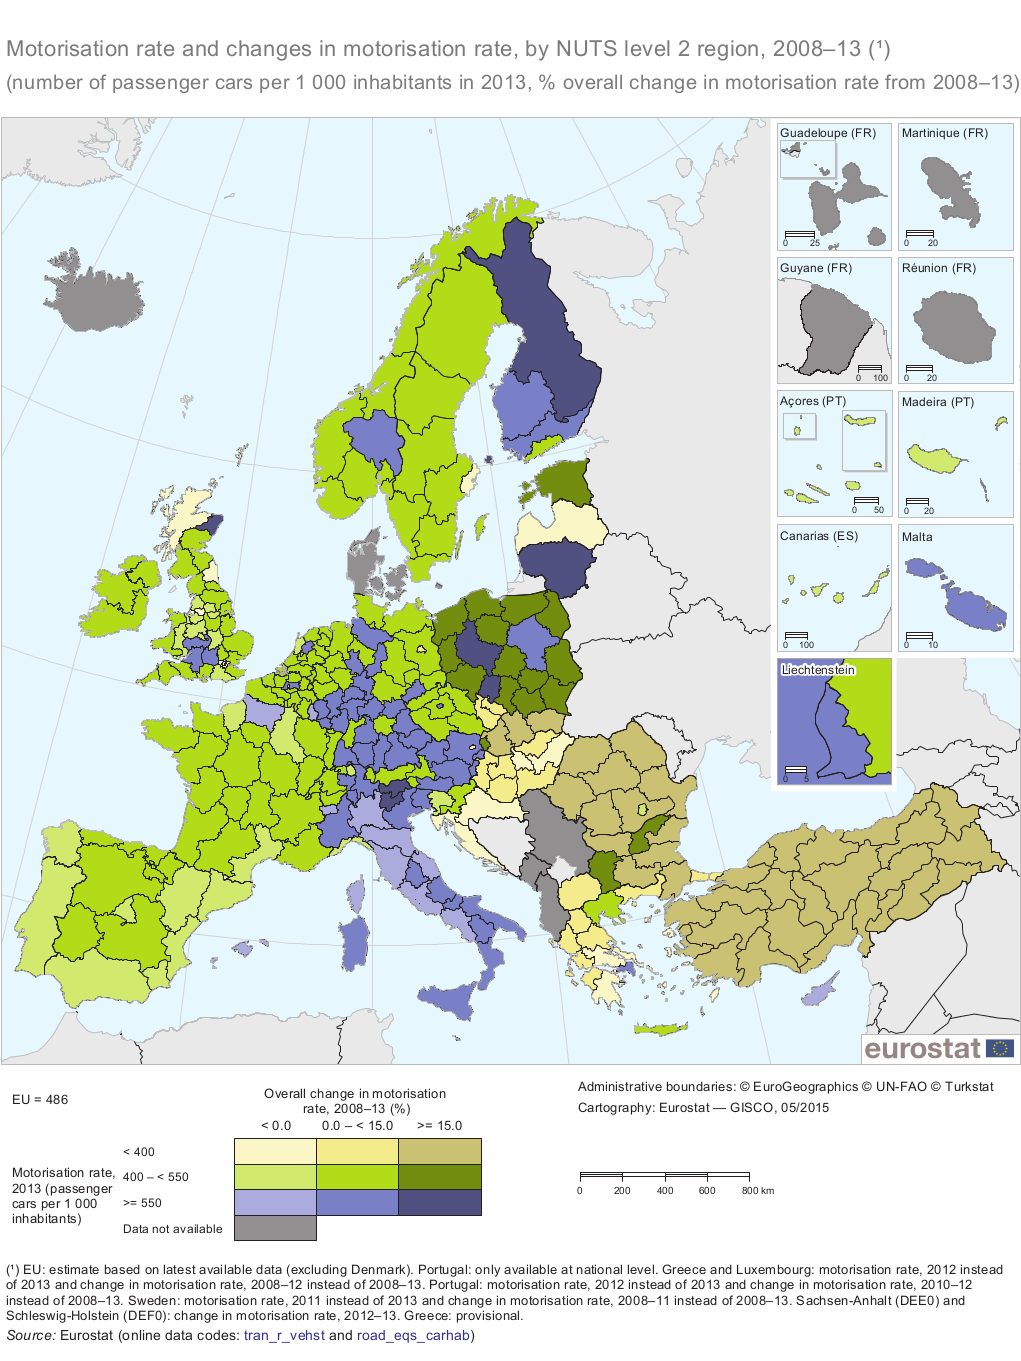
Size of this preview: 450 × 600 pixels. Other resolutions: 180 × 240 pixels | 1,021 × 1,361 pixels.
Original file (1,021 × 1,361 pixels, file size: 437 KB, MIME type: image/png)
File usage
There are no pages that use this file.
_(number_of_passenger_cars_per_1_000_inhabitants_in_2013,_%25_overall_change_in_motorisation_rate_from_2008–13)_RYB15.png&oldid=242931)
_(number_of_passenger_cars_per_1_000_inhabitants_in_2013,_%25_overall_change_in_motorisation_rate_from_2008%E2%80%9313)_RYB15.png)
_(number_of_passenger_cars_per_1_000_inhabitants_in_2013,_%25_overall_change_in_motorisation_rate_from_2008%E2%80%9313)_RYB15.png&action=edit&redlink=1)
_(number_of_passenger_cars_per_1_000_inhabitants_in_2013,_%25_overall_change_in_motorisation_rate_from_2008%E2%80%9313)_RYB15.png&action=history)