._Relative_weight_within_motor_vehicles_and_motorcycles_distribution,_EU-27,_2006_(%25).PNG)
. Relative weight within motor vehicles and motorcycles distribution, EU-27, 2006 (%).PNG&body=Statistics Explained - Motor vehicles and motorcycles distribution (NACE Groups 50.1, 50.2, 50.3 and 50.4). Relative weight within motor vehicles and motorcycles distribution, EU-27, 2006 (%).PNG %0A https%3A%2F%2Fec.europa.eu%2Feurostat%2Fstatistics-explained%2Findex.php%3Ftitle%3DFile%3AMotor_vehicles_and_motorcycles_distribution_%28NACE_Groups_50.1%2C_50.2%2C_50.3_and_50.4%29._Relative_weight_within_motor_vehicles_and_motorcycles_distribution%2C_EU-27%2C_2006_%28%2525%29.PNG)
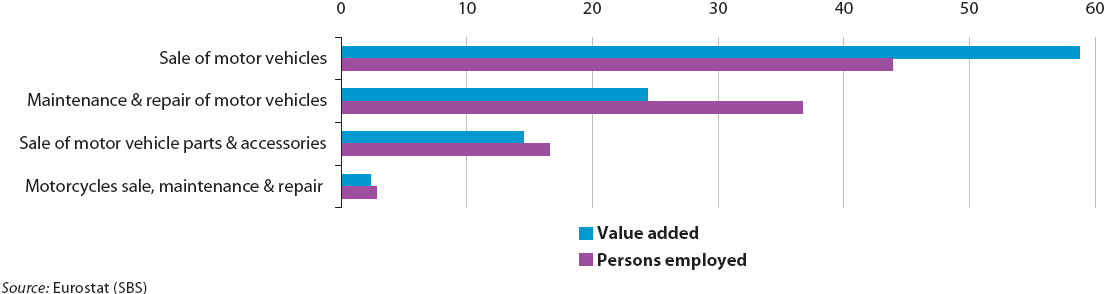
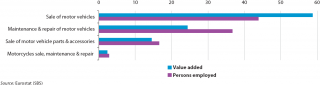
File:Motor vehicles and motorcycles distribution (NACE Groups 50.1, 50.2, 50.3 and 50.4). Relative weight within motor vehicles and motorcycles distribution, EU-27, 2006 (%).PNG
Size of this preview: 800 × 213 pixels. Other resolutions: 320 × 85 pixels | 1,105 × 294 pixels.
Original file (1,105 × 294 pixels, file size: 18 KB, MIME type: image/png)
Motor vehicles and motorcycles distribution (NACE Groups 50.1, 50.2, 50.3 and 50.4). Relative weight within motor vehicles and motorcycles distribution, EU-27, 2006
- (%)
Figure created with data from January 2009
File usage
The following page uses this file:
._Relative_weight_within_motor_vehicles_and_motorcycles_distribution,_EU-27,_2006_(%25).PNG&oldid=55210)
._Relative_weight_within_motor_vehicles_and_motorcycles_distribution,_EU-27,_2006_(%25).PNG)
._Relative_weight_within_motor_vehicles_and_motorcycles_distribution,_EU-27,_2006_(%25).PNG&action=edit&redlink=1)
._Relative_weight_within_motor_vehicles_and_motorcycles_distribution,_EU-27,_2006_(%25).PNG&action=history)