,_2006,_EU_27,_NUTS_3.png)
, 2006, EU 27, NUTS 3.png&body=Statistics Explained - Map 2. Variability of cropland productivity (indicated by the standard deviation of the productivity indices within the regions), 2006, EU 27, NUTS 3.png %0A https%3A%2F%2Fec.europa.eu%2Feurostat%2Fstatistics-explained%2Findex.php%3Ftitle%3DFile%3AMap_2._Variability_of_cropland_productivity_%28indicated_by_the_standard_deviation_of_the_productivity_indices_within_the_regions%29%2C_2006%2C_EU_27%2C_NUTS_3.png)
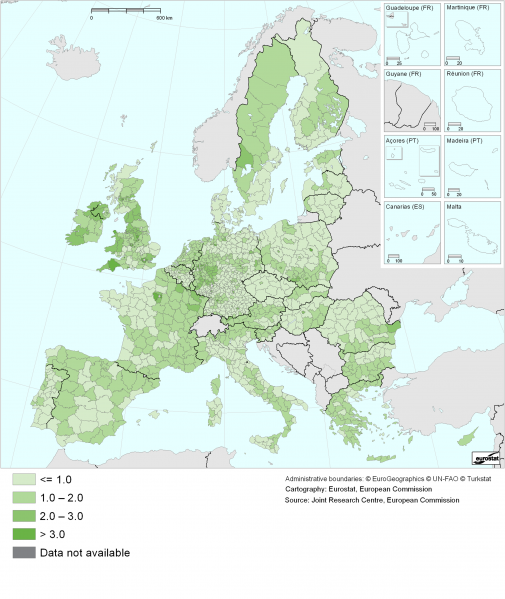
File:Map 2. Variability of cropland productivity (indicated by the standard deviation of the productivity indices within the regions), 2006, EU 27, NUTS 3.png

Size of this preview: 505 × 599 pixels. Other resolutions: 202 × 240 pixels | 2,488 × 2,953 pixels.
Original file (2,488 × 2,953 pixels, file size: 2.4 MB, MIME type: image/png)
Variability of cropland productivity (indicated by the standard deviation of the productivity indices within the regions), 2006, EU 27, NUTS 3
Graph created with data from 2006
Data extracted in July 2012. Most recent data available at:
Joint Research Centre, European Commission
File usage
The following file is a duplicate of this file (more details):
,_2006,_EU_27,_NUTS_3.png)
,_2006,_EU_27,_NUTS_3.png)
There are no pages that use this file.
,_2006,_EU_27,_NUTS_3.png&oldid=134238)
,_2006,_EU_27,_NUTS_3.png)
,_2006,_EU_27,_NUTS_3.png&action=edit&redlink=1)
,_2006,_EU_27,_NUTS_3.png&action=history)