_(%25_of_GDP)-de.png)
 (% of GDP)-de.png&body=Statistics Explained - Main categories of taxes and social contributions, EU-27, 2001-2011 (1) (% of GDP)-de.png %0A https%3A%2F%2Fec.europa.eu%2Feurostat%2Fstatistics-explained%2Findex.php%3Ftitle%3DFile%3AMain_categories_of_taxes_and_social_contributions%2C_EU-27%2C_2001-2011_%281%29_%28%2525_of_GDP%29-de.png)
File:Main categories of taxes and social contributions, EU-27, 2001-2011 (1) (% of GDP)-de.png
No higher resolution available.
Main_categories_of_taxes_and_social_contributions,_EU-27,_2001-2011_(1)_(%_of_GDP)-de.png (651 × 338 pixels, file size: 9 KB, MIME type: image/png)
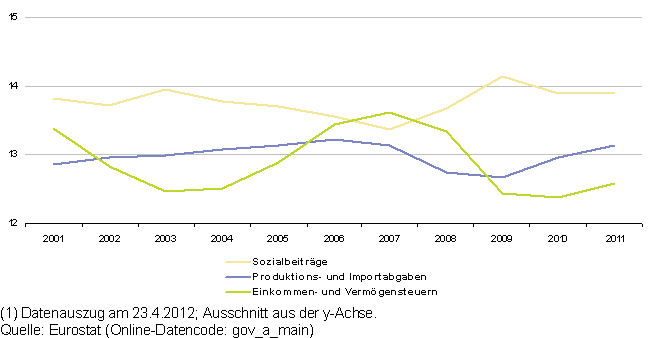
Abbildung 11: Hauptkategorien der Steuern und Sozialbeiträge, EU-27, 2001-2011 (1)
(in % des BIP) – Quelle: Eurostat (gov_a_main)
File usage
There are no pages that use this file.
_(%25_of_GDP)-de.png&oldid=100038)
_(%25_of_GDP)-de.png)
_(%25_of_GDP)-de.png&action=edit&redlink=1)
_(%25_of_GDP)-de.png&action=history)