File:Main categories of taxes and social contributions, 2011 (1) (% of GDP)-fr.png
Main_categories_of_taxes_and_social_contributions,_2011_(1)_(%_of_GDP)-fr.png (745 × 438 pixels, file size: 19 KB, MIME type: image/png)
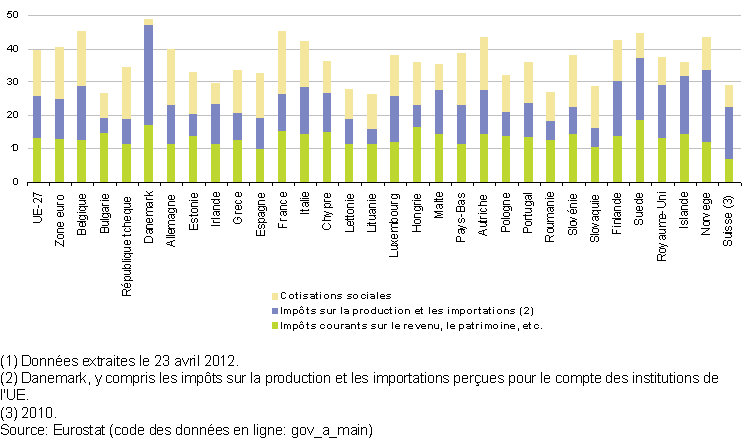
Graphique 12: Principales catégories d’impôts et cotisations sociales, 2011 (1)
(en % du PIB) - Source: Eurostat (gov_a_main)
File usage
There are no pages that use this file.
