_RYB19.png)
 RYB19.png&body=Statistics Explained - Housing cost overburden rate, 2017 (% share of people living in households where total housing costs represent more than 40 % of disposable income, by degree of urbanisation) RYB19.png %0A https%3A%2F%2Fec.europa.eu%2Feurostat%2Fstatistics-explained%2Findex.php%3Ftitle%3DFile%3AHousing_cost_overburden_rate%2C_2017_%28%2525_share_of_people_living_in_households_where_total_housing_costs_represent_more_than_40_%2525_of_disposable_income%2C_by_degree_of_urbanisation%29_RYB19.png)
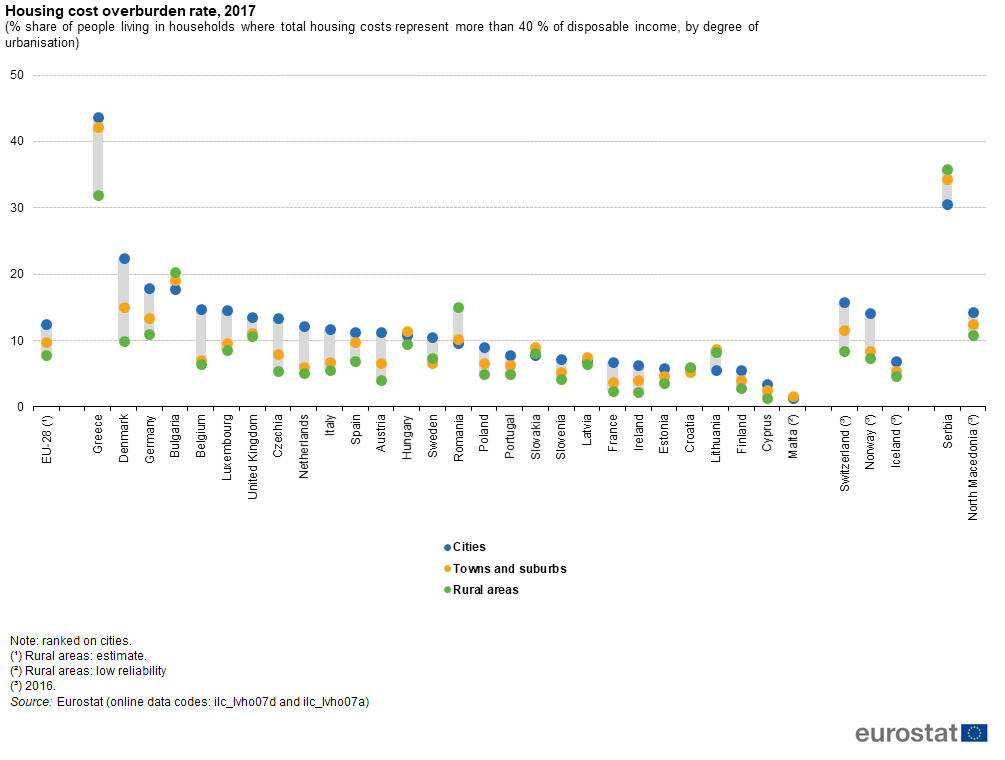
File:Housing cost overburden rate, 2017 (% share of people living in households where total housing costs represent more than 40 % of disposable income, by degree of urbanisation) RYB19.png
Size of this preview: 793 × 600 pixels. Other resolutions: 318 × 240 pixels | 1,005 × 760 pixels.
Original file (1,005 × 760 pixels, file size: 44 KB, MIME type: image/png)
File usage
The following 3 pages use this file:
_RYB19.png&oldid=439491)
_RYB19.png)
_RYB19.png&action=edit&redlink=1)
_RYB19.png&action=history)