_and_proportion_of_groundwater_monitoring_stations_in_each_class_per_country_(%25),_2009,_EU-27,_EFTA,_Candidate_and_Potential_Candidate_Countries_.png)
 and proportion of groundwater monitoring stations in each class per country (%), 2009, EU-27, EFTA, Candidate and Potential Candidate Countries .png&body=Statistics Explained - Groundwater nitrate concentration classes (mg NO3 per l) and proportion of groundwater monitoring stations in each class per country (%), 2009, EU-27, EFTA, Candidate and Potential Candidate Countries .png %0A https%3A%2F%2Fec.europa.eu%2Feurostat%2Fstatistics-explained%2Findex.php%3Ftitle%3DFile%3AGroundwater_nitrate_concentration_classes_%28mg_NO3_per_l%29_and_proportion_of_groundwater_monitoring_stations_in_each_class_per_country_%28%2525%29%2C_2009%2C_EU-27%2C_EFTA%2C_Candidate_and_Potential_Candidate_Countries_.png)
File:Groundwater nitrate concentration classes (mg NO3 per l) and proportion of groundwater monitoring stations in each class per country (%), 2009, EU-27, EFTA, Candidate and Potential Candidate Countries .png
Size of this preview: 506 × 600 pixels. Other resolutions: 202 × 240 pixels | 588 × 697 pixels.
Original file (588 × 697 pixels, file size: 17 KB, MIME type: image/png)
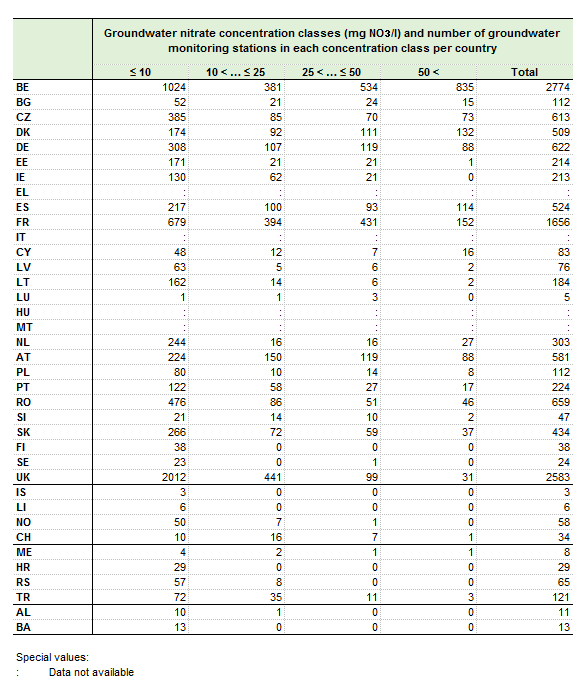
Groundwater nitrate concentration classes (mg NO3 per l) and proportion of groundwater monitoring stations in each class per country (%), 2009, EU-27, EFTA, Candidate and Potential Candidate Countries
Graph created with data from 2009.
Data extracted in November 2012. Most recent data available at:
EEA website WISE-SoE Groundwater: http://www.eea.europa.eu/data-and-maps/data/waterbase-groundwater-7
File usage
The following page uses this file:
_and_proportion_of_groundwater_monitoring_stations_in_each_class_per_country_(%25),_2009,_EU-27,_EFTA,_Candidate_and_Potential_Candidate_Countries_.png&oldid=127748)
_and_proportion_of_groundwater_monitoring_stations_in_each_class_per_country_(%25),_2009,_EU-27,_EFTA,_Candidate_and_Potential_Candidate_Countries_.png)
_and_proportion_of_groundwater_monitoring_stations_in_each_class_per_country_(%25),_2009,_EU-27,_EFTA,_Candidate_and_Potential_Candidate_Countries_.png&action=edit&redlink=1)
_and_proportion_of_groundwater_monitoring_stations_in_each_class_per_country_(%25),_2009,_EU-27,_EFTA,_Candidate_and_Potential_Candidate_Countries_.png&action=history)