-RYB18.png)
-RYB18.png&body=Statistics Explained - Gross value added per hour worked, by NUTS 2 regions, 2015 (based on data in EUR per hour worked in relation to the EU-28 average, EU-28 = 100)-RYB18.png %0A https%3A%2F%2Fec.europa.eu%2Feurostat%2Fstatistics-explained%2Findex.php%3Ftitle%3DFile%3AGross_value_added_per_hour_worked%2C_by_NUTS_2_regions%2C_2015_%28based_on_data_in_EUR_per_hour_worked_in_relation_to_the_EU-28_average%2C_EU-28_%253D_100%29-RYB18.png)
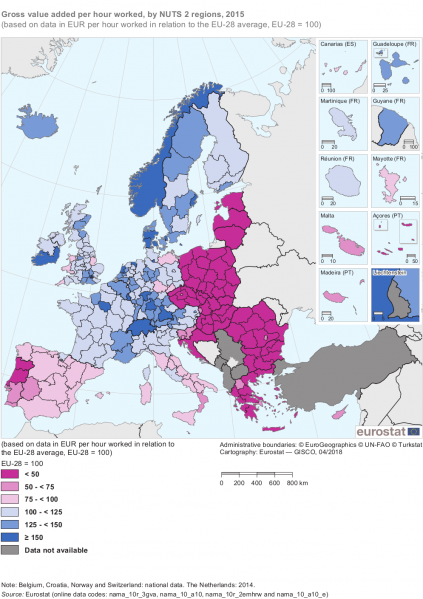
File:Gross value added per hour worked, by NUTS 2 regions, 2015 (based on data in EUR per hour worked in relation to the EU-28 average, EU-28 = 100)-RYB18.png

Size of this preview: 423 × 599 pixels. Other resolutions: 169 × 240 pixels | 995 × 1,410 pixels.
Original file (995 × 1,410 pixels, file size: 451 KB, MIME type: image/png)
File usage
There are no pages that use this file.
-RYB18.png&oldid=391934)
-RYB18.png)
-RYB18.png&action=edit&redlink=1)
-RYB18.png&action=history)