_(%25).PNG)
 (%).PNG&body=Statistics Explained - Gross operating rate within non-financial services, EU-27, 2006 (1) (%).PNG %0A https%3A%2F%2Fec.europa.eu%2Feurostat%2Fstatistics-explained%2Findex.php%3Ftitle%3DFile%3AGross_operating_rate_within_non-financial_services%2C_EU-27%2C_2006_%281%29_%28%2525%29.PNG)
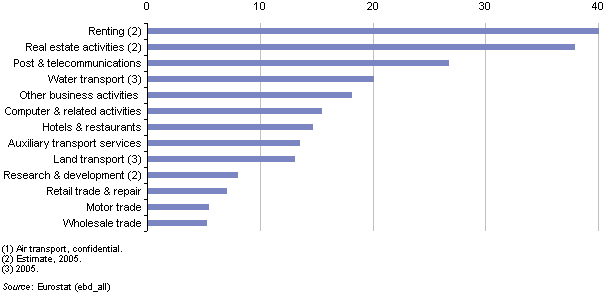
File:Gross operating rate within non-financial services, EU-27, 2006 (1) (%).PNG
No higher resolution available.
Gross_operating_rate_within_non-financial_services,_EU-27,_2006_(1)_(%).PNG (606 × 294 pixels, file size: 10 KB, MIME type: image/png)
Gross operating rate within non-financial services, EU-27, 2006 (1)
- (%)
Graph created with data from September 2009
Most recent data available now, see:
Selected indicators for all activities (NACE divisions) (ebd_all)
File usage
There are no pages that use this file.
_(%25).PNG&oldid=25257)
_(%25).PNG)
_(%25).PNG&action=edit&redlink=1)
_(%25).PNG&action=history)