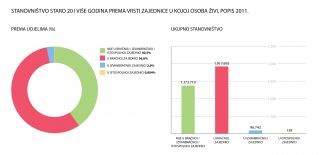
File:Graph 1 Population aged 20 and above according to the type of union a person lives in, 2011 Census NEW cro.jpg

Size of this preview: 800 × 388 pixels. Other resolutions: 320 × 155 pixels | 4,914 × 2,384 pixels.
Original file (4,914 × 2,384 pixels, file size: 724 KB, MIME type: image/jpeg)
File usage
The following file is a duplicate of this file (more details):
There are no pages that use this file.