File:GDP per inhabitant, in PPS, by NUTS 2 regions, average 2004–06.PNG
Size of this preview: 520 × 600 pixels. Other resolutions: 208 × 240 pixels | 824 × 950 pixels.
Original file (824 × 950 pixels, file size: 305 KB, MIME type: image/png)
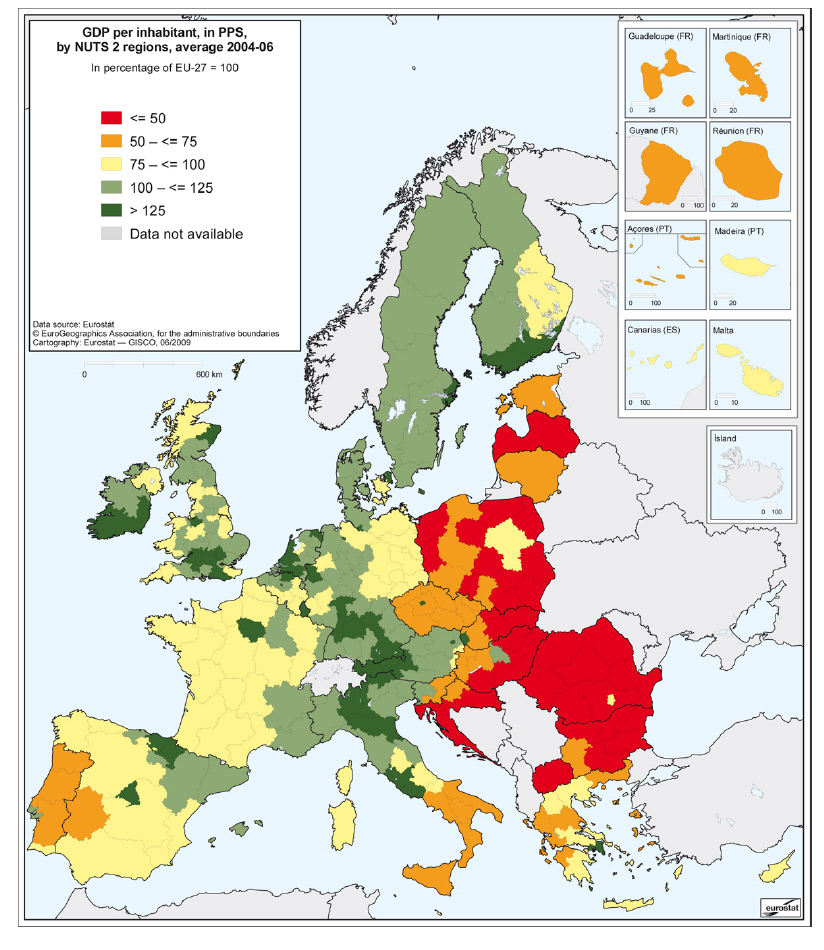
GDP per inhabitant, in PPS
- by NUTS 2 regions, average 2004–06
Map created with data from March 2009
Most recent data available now, see:
Regional gross domestic product (PPS per inhabitant), by NUTS 2 regions (tgs00005)
File usage
There are no pages that use this file.