_(%25)_Cities16.png)
 (%) Cities16.png&body=Statistics Explained - Functional urban areas with the lowest and highest proportion of households that own their accommodation, 2011 (¹) (%) Cities16.png %0A https%3A%2F%2Fec.europa.eu%2Feurostat%2Fstatistics-explained%2Findex.php%3Ftitle%3DFile%3AFunctional_urban_areas_with_the_lowest_and_highest_proportion_of_households_that_own_their_accommodation%2C_2011_%28%25C2%25B9%29_%28%2525%29_Cities16.png)
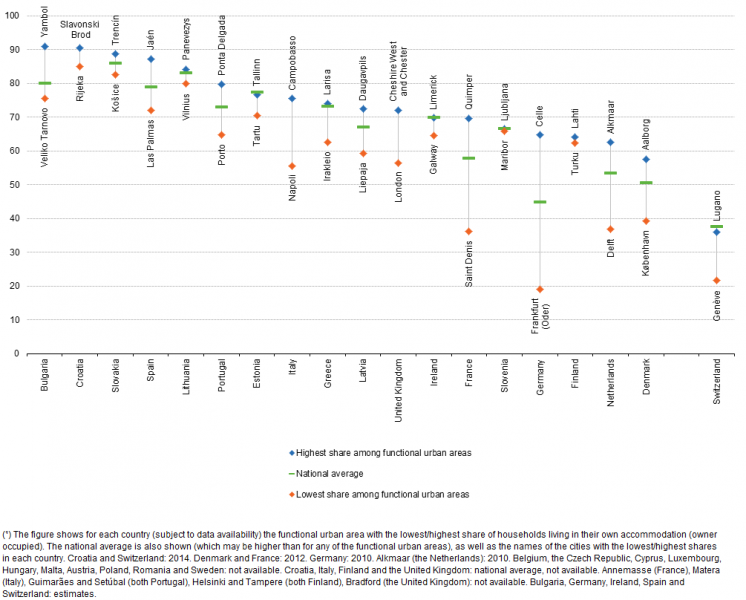
File:Functional urban areas with the lowest and highest proportion of households that own their accommodation, 2011 (¹) (%) Cities16.png

Size of this preview: 746 × 600 pixels. Other resolutions: 299 × 240 pixels | 1,005 × 808 pixels.
Original file (1,005 × 808 pixels, file size: 47 KB, MIME type: image/png)
File usage
The following page uses this file:
_(%25)_Cities16.png&oldid=294432)
_(%25)_Cities16.png)
_(%25)_Cities16.png&action=edit&redlink=1)
_(%25)_Cities16.png&action=history)