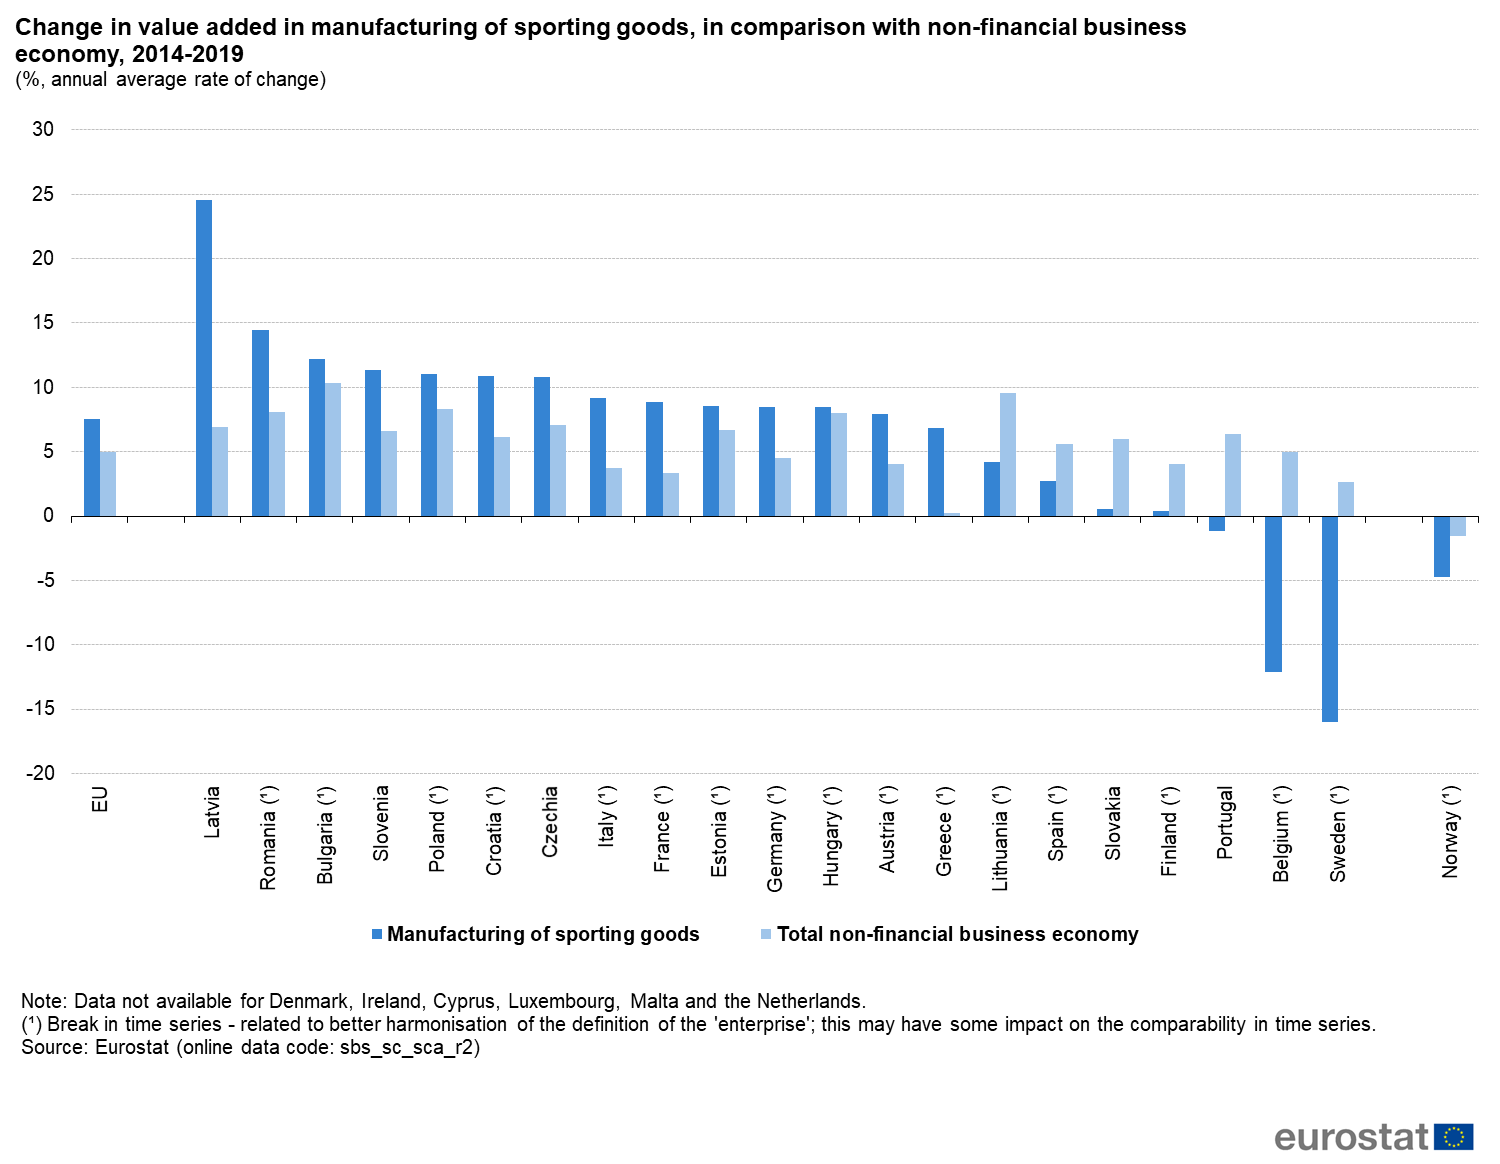
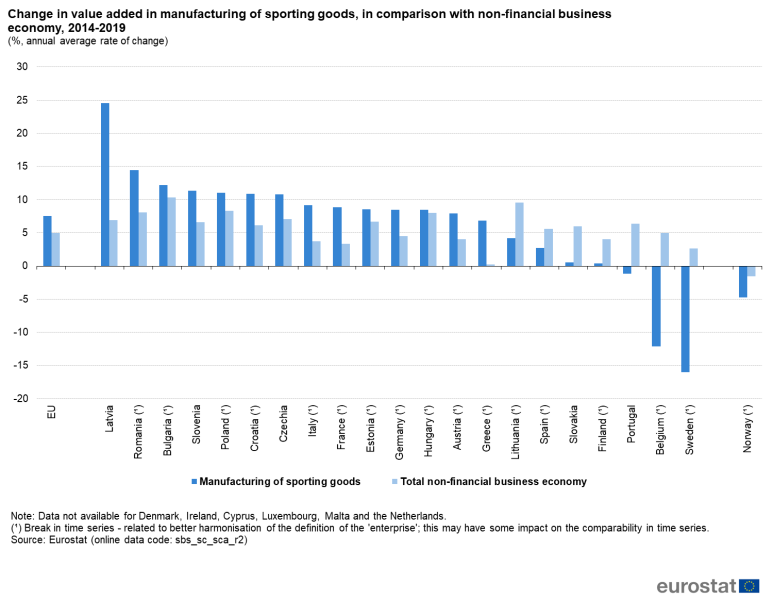
File:Figure 3 - Change in value added in manufacturing of sporting goods, in comparison with non-financial business economy, 2014-2019.png
Size of this preview: 773 × 600 pixels. Other resolutions: 309 × 240 pixels | 1,500 × 1,164 pixels.
Original file (1,500 × 1,164 pixels, file size: 107 KB, MIME type: image/png)
File usage
There are no pages that use this file.